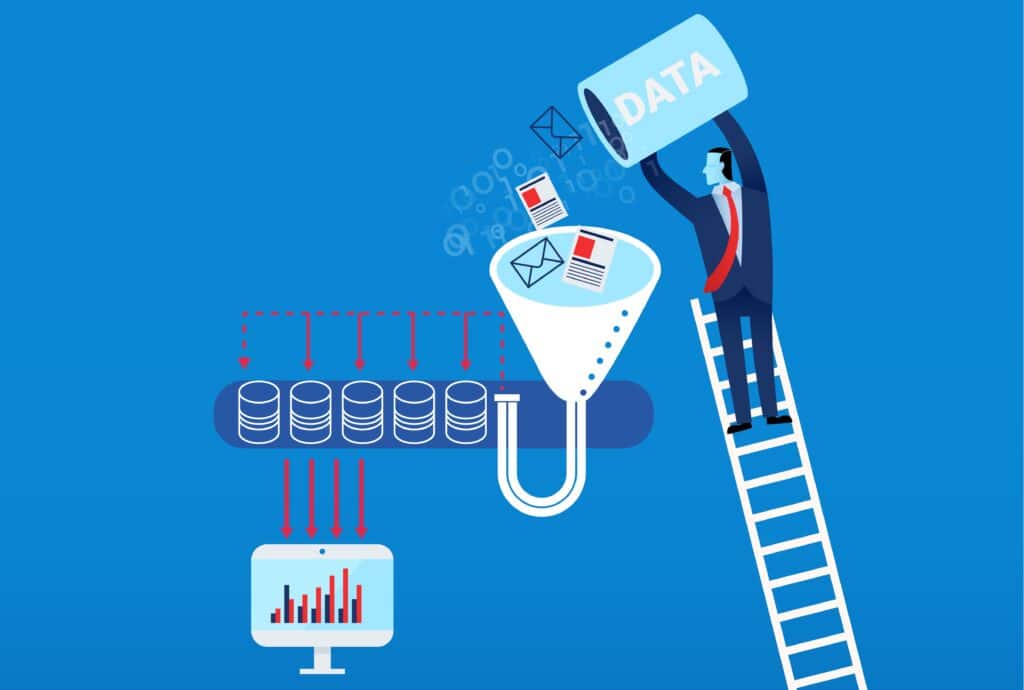
How to Avoid the 5 Most Common Data Visualization Mistakes
Although data visualization has been in place since 1780, when the first bar chart was produced by a toy company in Scotland, the practice is still imperfect…
Get expert advice on the latest trends and AI advancements
Although data visualization has been in place since 1780, when the first bar chart was produced by a toy company in Scotland, the practice is still imperfect…
While visualizing data, all of us know about the pie chart or the line graph. These graphs are some of the most common and basic visualizations of data...
Data wrangling done right produces timely, detailed information wrapped in an accessible format...
At its core, decision intelligence focuses on utilizing machine learning and data analytics to help professionals make important business decisions...
To squeeze value from the mess, you must inspect, scrub, and sort the file objects before feeding them to databases and warehouses...
Does your business need a data warehouse? On one hand, they accommodate complex modeling, improve workflows, and ultimately increase profits...
Everyone likes hearing a good story. However, being asked to “tell a story” using data and visualization is often a big source of anxiety for
So what’s the problem with unstructured data? As is the case with a tangle of wires, the hurdle with unstructured data is that it’s difficult
Get the latest product and data analytics insights. Straight to your inbox.
© 2023 Inzata. All Rights Reserved.