Categories
Big Data

Why Everyone Hates Spreadsheets

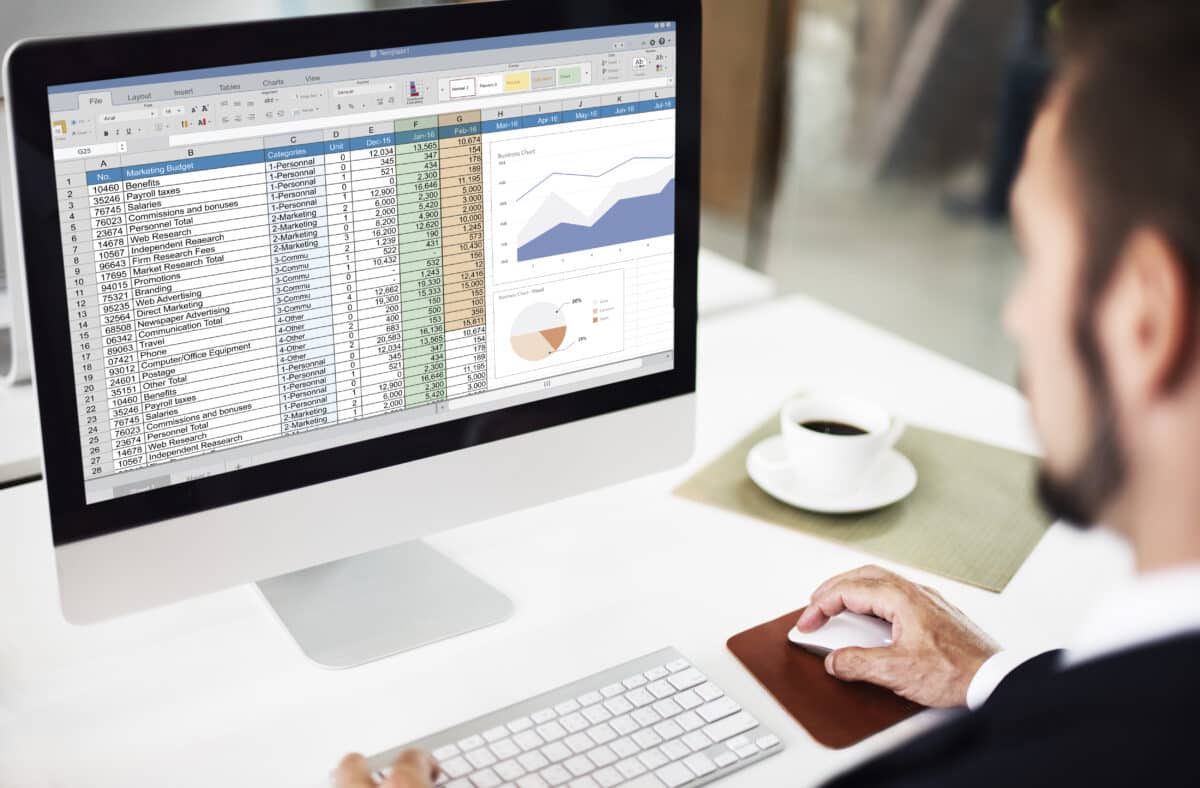
It’s Time to Part Ways With Excel Spreadsheets for Data Analysis

Excel is excellent for some things, like performing quick calculations or keeping track of your personal spending. Heck, it’s even great for startup e-commerce shops with minimal inventory or sales. But for other tasks and bigger businesses, Excel spreadsheets can create more problems than solutions. 

So, in an effort to hustle the world toward better IT solutions, we’re breaking down why everyone should be moving away from spreadsheets for data analysis work.

What Are the Pitfalls of Using Spreadsheets for Data?

Why don’t spreadsheets cut it anymore? There are a number of practical reasons for businesses and organizations to shy away from Excel. Some are simple functionality issues while others have only been recently discovered under specific work environments.

Overall, there are four main reasons: data inaccuracy, real-time update constraints, capacity breaks, and limited analytical parameters.

Data Inaccuracy

Spreadsheet accuracy is dependent on human accuracy — and that’s a recipe for disaster because it’s dangerously easy to mess up a field. Common mistakes include:

  • Mechanical Errors: Replacing formula fields with static numbers, keying in typos, and transferring mishaps rank among the most common mechanical spreadsheet errors. More than just simple mistakes, a single flub in one field can compromise the integrity of an entire workbook.
  • Logic Errors: Logic errors stem from bad formulas. Due to the relational nature of spreadsheets, a flawed foundational calculation has the power to compromise a whole document.
  • Errors of Omission: Due to workplace pipeline breakdowns, data can simply be left off spreadsheets. Unless there are validation checks built into your system, discovering such errors of omission may be impossible.

Lack of Real-Time Updates

Another problem with spreadsheets is their static nature. While several people can access a single document, things become easily jumbled when two or more people try to change it simultaneously. In many instances, the last person to enter data is not the person with the right figures.

Mistakes like this have a ripple effect, and it can be weeks before the problem is accurately identified — if it’s ever caught at all!

Capacity Breaks

In 2020, over 15,000 COVID-19 cases went unreported in the United Kingdom — all because of an Excel spreadsheet.

What happened?

Well, Public Health England (PHE) used Excel to collate data from hospitals and medical clinics across the country. But what the agency failed to realize is that the Excel version running on its network had a 65,536-row limit. To shorten a long story, the number of cases exceeded the cap, and the oversight triggered an administrative nightmare.

Excel was forged in the crucible of early tech — before the days of big data — and it still hews to the limited footprint of that time.

One-Dimensional Analysis

Spreadsheets were made for arithmetic and a bit of elementary calculus. But today’s data analysis procedures use more complex, multi-faceted approaches. Plus, you cannot measure progress or see status updates on spreadsheets, and the physical view is confined to a row-column setup, which forces constant back and forth scrolling.

These one-dimensional limitations are time wasters that ultimately eat into your bottom line.

What Are Some Spreadsheet Alternatives?

These days, there are thousands of superior programs that have muscled in on Excel’s market share. The trick is finding the ones that work best for your business and market niche. Partnering with an AI-powered data analysis platform is usually the way to go, as they can produce real-time insights and develop robust solutions tailored to your needs.

It’s time to move on from inefficient spreadsheets. Using one to coordinate game night is great, but demonstrably better options are available for data analysis and business projects.

Categories
Big Data Business Intelligence Data Analytics

What is the Half Life of Data?

Half-Life of Data Mean?

The term “half-life” was originally coined by scientists studying the amount of time it takes for at least 50% of a substance to undergo an extreme change. When studying analytics and data science, the term often comes up. 

While the half-life of data isn’t as exact a measure as the half-life of substances, the implications are similar. In this case, the half-life of data is referring to the amount of time it takes for the majority of it to become irrelevant. This is an exponential curve downwards, meaning that data is at its peak value when first collected, then accelerates in loss of value over time.

In a recent study, researchers highlighted the issue that administrators often underestimate or misunderstand the half-life of their data and the implications it carries. 

What Are the Three Business Categories of Data?

Nucleus Research found in their study that businesses driving decisions with data fall into one of three categories: tactical, operational, or strategic. The half-life of data varies by the business data category.

These categories were self-identified, and no real-world business is only one of these categories. Companies in the study were asked to select a category based on four factors: their suppliers, their markets, how regulated they are, and how much they depend on intellectual property.

Tactical

According to the study, the tactical category contains companies who utilize data to influence their processes in almost real-time. Because data received is extremely valuable when first received, then rapidly declines in value to the company, this category has the steepest downward curve of data half-life.

This category emphasizes how important it is for companies to have technology that allows them to act as quickly as possible on actionable data. The study found that, on average, the half-life of data in this category is a mere 30 minutes. That means data is losing a majority of its value in the first 30 minutes after collection!

Operational

The study indicates that companies using data for operational purposes generally require it to make decisions that could be anywhere from a day to a week. This is a mid-level category with a half-life curve that goes down exponentially, but far more slowly than data of companies in the “tactical” category.

Nucleus Research found that data in this category had an average half-life of 8 hours but ranged widely among companies, from one hour to 48 hours.

Strategic

Companies falling into this category use data for long-term processes and plans. Strategic data’s value is the most distributed, losing value very slowly over time. The half-life of their data is a small-slope linear graph. Strategic data’s average half-life is 56 hours and widely variable.

What Are 3 Ways to Speed Up Conversion from Raw Data into Actionable Insights?

Here are three ways to divert data from silos and process it into valuable and actionable insights for your business.

Ask Good Questions – In order for raw data to be valuable, it must have a defined purpose. Meeting with all stakeholders and determining what specific question you’d like answered, then identifying data that must be collected to answer it instantly increases the value of what you’re already collecting.

Use Segmentation – If possible, differentiate among types of clients or users as much as possible. This will create more individualized and accurate insights.

Create Context – Data silos happen when large, ambiguous groups of data are collected. Ensure that everyone understands what each piece of data actually means to instantly add value to logged data.

Categories
Data Analytics

What is Data Profiling & Why is it Important in Business Analytics?


What is Data Profiling?

The quality of data is measured by various types of data profiling. As Ralph Kimball puts it “Profiling is a systematic analysis of the content of a data source.” In simple terms, data profiling is examining the data available in the source and collecting statistics and information about that data. These profiling and quality statistics have a large effect on your business analytics.

Why is Data Profiling Important?

  • With more data comes greater emphasis on data quality, for optimal results from any analysis.
  • If the quality of your data is poor, it could affect your company’s success more than you think. It was reported by the Data Warehouse Institute that it costs $600 billion a year to American businesses to recover from data quality problems. Moreover, it also leads to delay and failure of large and important IT projects and goals.
  • High-quality data allows for companies in the retail industry to increase sales and customer retention rates.
  • Error-free decision making is the goal of any company in any industry. Proper profiling of data leads to just that.

Types of Data Profiling in Business Analytics

There are three main types of profiling:

  • Structure discovery: Verifying the data is reliable, consistent, and has been arranged correctly based on a specific format – for example, if US phone numbers have all 10-digits.
  • Content discovery: The discovery of errors by looking at individual data records – i.e. which phone numbers are missing a digit.
  • Relationship discovery: How the parts of data are interconnected. For example, key relationships between tables or references between cells or tables. Understanding relationships is imperative to reusing data. Related data sources should be combined into one or collected in a way that protects crucial relationships.

Best Practices for Data Profiling

Before you begin you data profiling journey, it is important to know and understand some proven best practices.

First, identifies natural keys. These are specific and distinct values in each column that can help process updates and inserts. This is useful for tables without headers.

Second, identify missing or unknown data. This helps ETL architects setup the correct default values.

Third, select appropriate data types and sizes in your target database. This enables setting column widths just wide enough for the data, to improve visibility and performance of the profiling.

Following these best practices will ensure your data to be improved to the highest quality, preparing it for further in depth analysis. The higher the quality of your data, the more precise the results produced by any analysis will be. It is extremely worth any analysts time and money to conduct data profiling steps before proceeding to calculate any information. Consider the role that data profiling companies and data profiling tools play in your journey to success. A single error of an immense amount of data could decrease the credibility of the analysis results.

Categories
Big Data Data Analytics

Are You Data-Driven or Just Data-Informed?

As much as companies pride themselves on their analytics initiatives and using data to drive decision making, most companies are not as data-driven as they make themselves out to be. Despite the ample resources and hard data available to them, many executives still base their final decisions on intuition or the infamous gut feeling. 

While there are many ways to approach how you ultimately use data to drive decisions, the most common frameworks on the matter are data-driven decision making and data-informed decision making. In order to understand each approach and which is best for your organization, let’s explore the key differences between the two.

Data-Driven: What Does it Mean?

You’ve probably heard a lot of talk surrounding the importance of being data-driven, especially in light of responding to the recent global events. But what does being data-driven actually mean in practice? 

Being data-driven doesn’t mean solely investing in the newest data analytics tools or focusing entirely on having the highest quality data possible. Being data-driven means allowing your data to guide you in the right direction. Think of this as the metrics heavy approach where full faith is often placed in the numbers. This means basing decisions on key insights and making sure analysis is always taken into consideration. In this approach, your data will have the heaviest weight in the decision-making process over any other factor. 

Data-Informed: What Does it Mean?

On the other hand, being data-informed means using data to check or validate your intuition. You could say this approach primarily is used to confirm or deny that gut feeling when it comes to your decision-making. Here data isn’t necessarily the focus of the decision-making process but is instead a useful resource in proving or disapproving certain hypotheses.

What’s the Difference?

The primary difference between the approaches is the degree to which data is used and valued overall. Data-driven culture places data at the heart of your decision-making process, predominantly weighting the numbers and metrics involved. Data-informed culture is when data is used as one of many variables taken into account. Typically other factors include the context and behavior surrounding the data, however, this makes decisions vulnerable to bias or subjectivity. 

Which Approach is Better?

While the difference between the two approaches might seem minimal, the method by which your organization makes decisions can have significant long term effects. Which framework to adopt is dependent on the strategic objectives of your organization as well as the data you have available.

To get started, try asking yourself questions such as:

  • How much data do you have available? 
  • How confident are you in the data’s quality or reliability?
  • What type of problem are you trying to solve?
  • What are the overarching goals of your department or organization?

Conclusion

Regardless of these approaches, data isn’t the end all be all to successful decision making. It can’t predict the future or ensure your final decision will lead to an increased bottom line or record-breaking sales for the quarter. However, it does give you a better understanding of the situation at hand and can be an effective tool when determining your direction. 

Categories
Data Monetization

Your Company’s Financial Data Has Immense Hidden Value

Using financial data to mine for insights, present reports and handle other critical tasks has become a major reason for the popularity of computer-driven analytics. That has led to immense competition, and consequently, there is immense value in digging through financial data to find what may be hiding. Let’s take a closer look at what financial data is, how it is used and what hidden value may be lurking within it.

What is Financial Data?

Financial data generally refers to information that can be derived from accounts and securities. The most basic forms of financial data include things like cash flow, net income and total assets. Notably, the idea extends far beyond those three items, but these three provide the most accessible way to understand what financial data is. This information is useful in:

  • Providing credit to individuals and companies
  • Establishing buy and sell points on stocks
  • Financial planning
  • Placing valuations on businesses
  • Determining interest rates
  • Forecasting future economic conditions
  • Detecting misrepresentations and fraud

In other words, you likely interact with lots of financial data on a daily basis even if you’ve never invested a dollar.

How is Financial Data Used?

Utilizing financial data is increasingly about feeding information into machines. For example, credit card companies regularly monitor transactions worldwide to detect patterns of theft, fraud and misuse. Your bank account might be flagged because your ATM card was detected in use in a geographic location you’ve never been to.

Analysis of financial data is performed using an array of mathematical, statistical and programming tools. The loan officer assigned to determining whether you might get a mortgage may use a computer model that compares your financial situation to similar customers to assess what your risk of default is. That requires access to large datasets, and it’s essential to have enough processing power to make the comparisons rapidly enough for them to be relevant.

Sources of data are also quickly becoming more diverse. Where financial data was once limited to banks and stock traders, we’re seeing actionable information come from previously unthinkable sources. For example, a mercantile exchange trader may gather data from farmers in the Midwest to determine whether crop yields will be up this summer. Similarly, farmers can become sellers of their data, transmitting information from IoT sensors placed in field to co-ops that then monetize the data by selling it to traders.

Where is the Hidden Value?

Data is rarely is a true representation of a thing in the real world, and that means getting at what might be hiding requires some tricks. For example, Bayesian analysis is frequently used in assessing medium- and long-term risks in stock markets, bonds and other financial instruments. Traders configure their models and buying programs according to a wide range of variables, including their comfort with risks and how concerned they might be by potential shocks in the market.

Differences in how analysis is done mean there will always be parties with different opinions of the future. These differences are often referred to as market inefficiencies, and much of the hidden value in financial data lies here. For example, there will always be differences in the estimates of the core brand values of different products. Someone using social media analytics might identify an old brand that’s making a comeback and buy into its parent company’s stock to leverage that advantage. That’s hidden value.

It takes time to become familiar with the tools and techniques used to assess financial data. With time, though, you can utilize it to begin maker better decisions about assets, liabilities and risks.

Categories
Big Data Data Science Careers

8 Tips & Tricks for Data Scientists

Whether you already work in the data science field or wish to get into it, there’s a lot of benefit in always expanding your bag of tricks. The field is grounded in statistics, and there’s also a rapidly growing trend toward automation. Being tech- and math-savvy is absolutely critical. Let’s take a look at 8 tips and tricks you’ll want to know as a data scientist.

#1: Learn to Program

With data science already heavily dependent on computing resources and machine learning quickly become the top way to derive insights, coding skills have never been more important. Fortunately, you don’t have to be a full-fledged application developer. Several programming languages are being increasingly tailored to serve those who need to build their own data analysis tools. Two of the biggest languages worth keeping up with are:

  • Python
  • R

If you’re looking to perform work using modern machine learning systems like TensorFlow, you’ll likely want to steer toward Python, as it has the largest set of supported libraries for ML. R, however, is very handy for quickly mocking up models and processing data. It’s also prudent to pick up some understanding of database queries.

#2: Develop a Rigid Workflow for Each Project

One of the biggest challenges in the world of data analytics is keeping your data as clean as possible. The best way to meet this challenge head on is to have a rigid workflow in place. Most folks in the field have set down these steps to follow:

  1. Gather and store data
  2. Verify integrity
  3. Clean the data and format it for processing
  4. Explore it briefly to get a sense of the dataset’s apparent strengths and weaknesses
  5. Run analysis
  6. Verify integrity again
  7. Confirm statistical relevance
  8. Build end products, such as visualizations and reports

#3: Find a Focus

The expanding nature of the data analytics world makes trying to know and explore it all as impossible as getting to the edge of the universe. It might be fun to explore machine vision to identify human faces, for example, but that skill likely isn’t going translate well if your life’s work is doing plagiarism detection.

In order to find a focus, you need to look at the real-world problems that interest you. This will then allow you to check out the data analysis tools that are commonly used to solve those problems.

#4: Always Think About Design

How you choose to analyze data will have a lot of bearing on how a project turns out. From a design standpoint, this means confronting questions like:

  • What metrics will be used?
  • Is this model appropriate for this job?
  • Can the compute time be optimized more?
  • Are the right formats being used for input and output?

#5: Make Data Scientist Friends with Github

Github is a wonderful source of code, and it can help you avoid needlessly reinventing the wheel. Register an account, and then learn the culture of Github and source code sharing. That means making a point of providing attribution in your work. Likewise, try to contribute to the community rather than just taking from it.

#6: Curate Data Well

One of the absolute keys to getting the most mileage out of data is to curate it competently. This means maintaining copies of original sources in order to allow others to track down issues later. You also need to provide and preserve unique identifiers for all your entries to permit tracking of data across database tables. This will ensure that you can distinguish duplicates from mere doppelgängers. When someone asks you to answer questions about oddities in the data or insights, you’ll be glad you left yourself a trail of breadcrumbs to follow.

#7: Know When to Cut Losses

Digging into a project can be fun, and there’s a lot to be said for grit and work ethic when confronting a problem. Spending forever fine-tuning a model that isn’t working, though, carries the risk of wasting a significant portion of the time you have available. Sometimes, the most you can learn from a particular approach is that it doesn’t work.

#8: Learn How to Delegate

Most great discoveries and innovations in the modern world are the final work products of teams. For example, STEM-related Nobel Prize are pretty much never awarded to individual winners anymore. While the media may enjoy telling the stories of single founders of companies, the reality is that all the successful startups of the internet age were team projects.

If you don’t have a team, find one. Recruit them in-house or go on the web and find people of similar interests. Don’t be afraid to use novel methods to find team members, too, such as holding contests or putting puzzles on websites.

Click here to read more

Polk County Schools Case Study in Data Analytics

We’ll send it to your inbox immediately!

Polk County Case Study for Data Analytics Inzata Platform in School Districts

Get Your Guide

We’ll send it to your inbox immediately!

Guide to Cleaning Data with Excel & Google Sheets Book Cover by Inzata COO Christopher Rafter