Categories
Business Intelligence Data Analytics

The Comprehensive Guide to Healthcare Analytics

What is Healthcare Analytics?

The healthcare analytics field involves collecting and analyzing data from health services in order to make improved medical decisions in the future. The goal of the field is to support overarching health domains, ranging from prescriptions to microcosmic areas such as rare diseases. Better care can be given to patients in less time than ever before due to the introduction of BI and healthcare analytics tools. 

Depending on the field of medical practice in which healthcare analytics software is used, the benefits vary. For example, a small local practitioner may see the biggest benefit in having access to public health information derived from large hospital groups. Through this, the practitioner may be able to gain insights they otherwise would not have access to. On the other hand, the largest benefit that a large hospital may see in healthcare analytics could be streamlining patient charts and records. This can significantly lower the chances of losing records and ensures flexible access to needed information.

How Does the Healthcare Industry Use Healthcare Analytics?

The healthcare industry uses healthcare analytics to support services on all fronts. From ensuring positive patient experiences to lowering readmission rates to payer and insurance services, healthcare analytics has a wide array of purposes.

The high-risk patient population is one demographic assisted by healthcare analytics. This type of software digitizes healthcare records and leverage Artificial Intelligence (AI) to easily flag and identify high-risk patients. Physicians can utilize this data to divert patients from potential emergency room visits down the line. Extremely intricate risks, such as a rare polydrug reaction that can only occur with certain uncommon diseases, can be instantly highlighted and then mitigated by the prescribing physician.

Human error is also significantly cut down by healthcare analytics. Anomalies in prescription dosages can be found before a patient is prescribed the wrong amount. Both doctors and insurance companies can automate lengthy claims processes, allowing doctors to spend more time one-on-one with patients and less time haggling with insurers. In the most significant cases, even accidental death with lasting medical, fiscal, and personal problems attached can be prevented; this is particularly beneficial for larger offices with more doctors and patients since the onus is no longer solely on the doctor to have a clear and comprehensive view of the patient.

How Healthcare Analytics is Transforming Healthcare

Healthcare is rapidly evolving, primarily due to innovations in healthcare analytics software. Business Intelligence (BI) is one such innovation that’s been a game-changer. The costs of operation, workflow, and automated decision-making software involved are all evolving over time. Indirectly, healthcare facilities and practitioners benefit from data aggregated and analyzed from other facilities to help each other identify public health issues like COVID-19, as we’ve seen over the past couple of years.

Another more recent evolution in healthcare analytics is Population Health Management (PHM). This is a more modern approach to health; while traditional healthcare is reactive to situations that emerge, PHM focuses on preventing possible issues that could occur in the future. This is far more efficient in terms of time and money, but it requires predictive modeling in order for it to work in the public sector.

To perform PHM using healthcare analytics software, there must be a first, large initial data set. Using this, specific diagnoses can be analyzed and patterns can be found. In other words, AI can essentially perform medical research on very specific populations to inform doctors on public health problems and how they may work to help lower incidences in their local communities.

Wrapping Up Healthcare Analytics

It’s clear that healthcare analytics software is used extensively across the strata of medicine. Patients see instant value in this because it makes everything from new patient signup to paying copays much easier and more streamlined. Practitioners also see an instant return on investment from healthcare analytics by lessening manual research time and administrative headaches. Even insurance companies benefit, as do their customers, by being able to process items like prior authorizations and the like at a much faster rate than ever before.
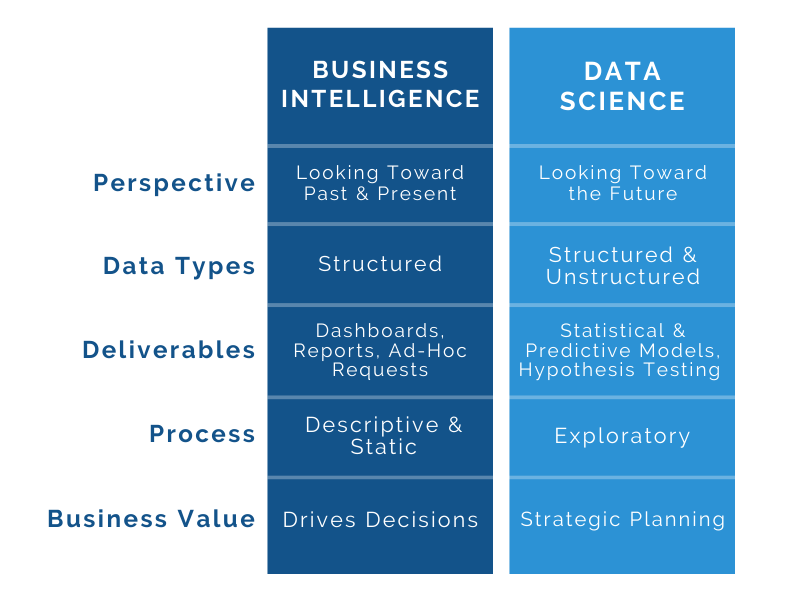
Categories
Big Data Business Intelligence Data Analytics

Data Storytelling: The Essential Skill for the Future of Analytics

Collecting data and performing analysis doesn’t mean much if you can’t find a way to effectively convey its meaning to an audience. Oftentimes, audience members aren’t well-positioned to understand analysis or to critically think about its implications. To engage with an audience, you need to embrace storytelling. Let’s take a look at what that means when talking about storytelling with data.

How to Build a Story Arc

One of the simplest ways to approach the problem is to treat your story as a three-act play. That means your story will have:

  • An introduction
  • A middle
  • A conclusion

Each section of the story needs to be delineated so the audience understands the structure and the promise of a story that comes with it.

What Goes into an Introduction

In most cases, data is hidden before being subjected to analysis. That means you have to set the scene, giving the audience a sense of why the data is hidden and where it came from. You don’t necessarily want to jump right to conclusions about the data or even any basic assumptions. Instead, the data should be depicted as something of a mysterious character being introduced.

If the storytelling medium is entirely visual, then you need to find a way to present the data. The Minard Map is a classic example of how to do this. It uses data to tell the story of the slow destruction of Napoleon’s army during the invasion of Russia. Minard employs a handful of vital statistics to explain what’s going to happen as the story unfolds. These include the:

  • Sizes of the competing armies
  • The geographic proximity of the two forces 
  • Air temperature
  • Rainfall

The audience can familiarize themselves with the data quickly and easily understand what this story is going to entail just by reading the vital statistics. In this particular case, this story is going to be about man versus the elements.

Unfolding the Middle of the Story

Following the presentation of the story should guide the audience toward the conclusion. In the case of the Minard Map, the middle of the story is about a slowly shrinking French army and a slowly growing Russian army that tracks the French. Military engagements occur, and the weather starts to turn. Geographic elements are worked into the graph, too, as the armies cross rivers and march into towns.

Providing the Conclusion

A well-executed data visualization should let the audience get to the conclusion without much prodding. The Minard Map makes its point without beating the audience over the head. By the third act, it’s clear that the conditions have turned and the Russians are now close to matching the French in manpower. As the two armies reach Moscow, it’s clear that what started as a triumphant march has ended as an immense loss.

In its best form, data storytelling shouldn’t feel like a sea of numbers at all. People have seen numerous charts and graphs in their lifetimes, even over the regular course of a single day of business, and that means good-enough visualizations that are focused on presenting numbers tend to become white noise.

Takeaways

Good data storytellers make history. Florence Nightingale’s analysis of casualties during the Crimean War permanently changed the way all forms of medical treatment are provided. Her work is still required reading at many nursing and medical schools more than 150 years later. That’s the goal: to engage the audience so thoroughly that the story and the data long outlast your initial presentation.

Accomplishing that goal requires planning. You can’t just fire up your best data visualization software, import some info from Excel and let the bars and bubbles fly. That’s easy to do because many software packages can deliver solid-looking results in a matter of minutes.

Top-quality data storytelling occurs when the audience is given just enough information to set and understand the scene. Someone scanning the visualizations will then follow the information as it unfolds over time. As the audience approaches the conclusion, they should be left with a strong impression regarding what the data says and what they should learn from it.

Categories
Business Intelligence

Data Science vs. Business Intelligence: What’s the Difference?

In today’s business world, it seems like all decisions and strategies ultimately point back to one thing: data. However, how that data is being used to find value and produce insights from within the data stack is a different story. Business intelligence and data science are two terms often used interchangeably when talking about the who, what, why, and how of working with data. 

While they both appear to work with data to solve problems and drive decision-making, what’s the real difference between the two? Let’s get back to the basics by diving into the similarities and differences of each when it comes to their core functions, deliverables, and overall role as it relates to data-driven decision-making.

What is Business Intelligence?

Business intelligence is developing and communicating strategic insights based on available business information to support decision-making. The purpose of business intelligence is to provide a clear understanding of an organization’s current and historical data. When BI was first introduced in the early 1960s, it was designed as a method of communicating information across business units. Since then, BI has evolved into advanced practices of data analysis but communication has remained at its core.

Additionally, BI is much more than processes and methods for analyzing data or answering specific business questions, it also includes the technologies behind those methods. These tools, often self-service, allow users to quickly visualize and understand business information.

Why is Business Intelligence Important?

Since data volumes are rapidly increasing, business intelligence is more essential than ever in providing a comprehensive snapshot of business information. This gives guidance towards informed decision-making and identifying areas of improvement, leading to greater organizational efficiency and an increased bottom line.

What is Data Science?

While there is no universally accepted definition of data science, it’s generally accepted as a field that embraces many disciplines, including statistics, advanced programming skills, and machine learning, in order to generate actionable insights from raw data. 

In simple terms, data science is the process of obtaining value from a company’s data, usually to solve complex problems. It’s important to note that data science is still developing as a field and this definition is continually evolving with time.

Why is Data Science Important?

Data science is a guide through which companies are able to predict, prepare, and optimize their operations. Moreover, data science can be pivotal to the user experience, for many businesses data science is what allows them to offer personalized and tailored services. For instance, streaming services, such as Netflix and Hulu, are able to recommend entertainment options based on the user’s previous viewing history and taste preferences. Subscribers spend less time searching for what to watch and are able to easily find value amongst the hundreds of offerings, giving them a unique and personally curated experience. This is significant in that it increases customer retention while also enhancing the subscriber’s ease of use. 

Business Intelligence vs. Data Science: What’s the Difference?

Generally speaking, business intelligence and data science both play a key role in producing any organization’s actionable insights. So where exactly is the line between the two? When does business intelligence end and data science begin?

BI and data science vary in a number of ways, from the type of data they’re working with to project deliverables and approaches. See the figure below for a visual distinction between the most common attributes of the two.

Perspective

Business intelligence is focused on the present while data science is looking towards the future and predicting what might happen next. BI works with historical data in order to determine a responsive course of action while data science creates predictive models that recognize future opportunities.

Data Types

Business intelligence works with structured data that is typically data warehoused or stored in data silos. Similarly, data science also works with structured data but predominantly is tasked with unstructured and semi-structured data, resulting in greater time dedicated towards cleaning and improving data quality.

Deliverables

Reports are the name of the game when it comes to business intelligence. Other deliverables for business intelligence include things like building dashboards and performing ad-hoc requests. Data science deliverables have the same end goal in mind but focus heavily on long-term and forward-looking projects. Projects will include building models in production rather than working from enterprise visualization tools. These projects also place a heavyweight on predicting future outcomes as opposed to BI’s focus on an organization’s current state.

Process

The distinction between the processes of each comes back to the perspective of time, similarly to how it influences the nature of deliverables. Business intelligence revolves around descriptive analytics, this is the first step of analysis and sets the stage for what has already happened. This is where non-technical business users can understand and interpret data through visualizations. For example, business managers can determine how many of item X was sold in July from promotional emails versus through direct website traffic. This then leads to additional digging and analysis regarding why some channels performed better than others. 

Continuing with the previous example of item X, data science would take the exploratory approach. This means investigating the data through its attributes, hypothesis testing, and exploring common trends rather than answering business questions on performance first. Data scientists often start with a question or complex problem but this typically evolves upon exploration.

How Do BI & Data Science Drive Decisions?

While business intelligence and data science are both used to drive decisions, their perspective is central to determining the nature of decision-making. Due to the forward-looking nature of data science, it’s most often at the forefront of strategic planning and determining future courses of action. These decisions, though, are often preemptive rather than responsive. On the other hand, business intelligence aids decision-making based on previous performance or events that have occurred. Both disciplines fall under the umbrella of providing insights that will support business decisions, but the element of time is what distinguishes the two.

However, it’s important to note that this might not always be the case for every organization. The lines between the responsibilities of BI and data science teams are often blurred and vary from organization to organization.

Conclusion

Despite their differences, the end goal of business intelligence and data science is ultimately aligned. It’s important to note, though, the complementary perspectives of the two. Examining the past, present, and future through data remains vital to staying competitive and addressing key business problems.

Categories
Big Data Business Intelligence Data Analytics

3 Things Companies Are Doing Right Now to Bounce Back

The past year has been filled with a long list of unforeseen challenges for all organizations. This uncertainty has left businesses with more and more questions that need to be answered, particularly when it comes to their strategies moving forward. 

There’s no question that data and analytics are paving the way for businesses in the post-pandemic world, but what exactly are companies doing right now to bounce back? Let’s take a closer look at what leading companies are doing to get back on track and prepare for growth in a post-COVID world.

Investing in the Digital Future

There has always been an enormous amount of talk surrounding the need for digital transformation. Organizations have long used the buzzword loosely when discussing their strategy and high-level goals. For many years, there has been a recognized need for these digital efforts but the transformation has been slow to move. The recent market disruptions, though, have catalyzed digital transformation and emphasized the importance of cost optimization and process improvement through new digital strategies. 

Industry leaders are doubling down on their investment in digital strategy and IT implementation. According to a recent Gartner survey, 69% of board of directors have accelerated their digital business initiatives due to COVID’s disruption. This has caused an increase in “forward-looking investments” that will aid in quick responses to unexpected events. Through widespread digital transformation, there has been an apparent shift towards preparedness and the improved agility of organizations as a whole. 

Additionally, digital transformation opens doors for things like customer engagement due to increased customer visibility and opportunities for personalization. Many companies are entirely transforming their business model while expanding their digital product offerings as a means for revenue growth. 

To start accessing your own digital strategy, start by asking questions such as:

  • How is your digital investment aligned with your business goals?
  • What metrics and KPIs need to be tracked to effectively measure change?
  • What strategies and high-level goals should be understood at all levels of the organization?

Data-Driven Decision Making

Decisions, decisions, decisions. The one thing you can always count on to remain constant in business, regardless of any change and uncertainty in the business environment. The road following a disruption, though, is filled with new questions surrounding customer behaviors and strategic decisions that need to be made quickly. 

The recent marketplace changes have highlighted the need for rapid decision-making. Rapid decision-making falls into both an organization’s preparedness and ability to adapt to evolving situations. Using data to drive and inform decision-making is no longer considered a competitive advantage, but instead is identified as a need in order to compete. Whether you’re predicting staff and inventory requirements or evaluating online buying behaviors through customer analytics, data should be at the core.

Not Putting Things Off

Arguably the most important thing companies are doing to bounce back from the downturn is taking action. The time is now, stop putting things off! The vast majority of companies deferred a number of initiatives and business development efforts due to COVID. You’ve likely heard it used as an excuse to delay or revisit a project in the future yourself. 

Nevertheless, progress or effective change never came from putting something on the back burner. You can’t expect growth to happen on its own and continue to delay efforts until things go back to what was once considered normal. Reevaluate your priorities, preparedness, and strategies from the individual level all the way up to the overarching organization. 

Review

To sum up, the points stated above, the key to moving forward is all about adapting to changing situations. Whether it’s your ability to quickly generate insights that will drive decision-making or investing in new digital channels, it all comes back to how prepared you are to respond and adapt to change.

Categories
Big Data Business Intelligence Data Science Careers

How to Become the BI Rookie of the Year

With the new year upon us and new opportunities at hand, it’s time to get your head in the game. There’s a business intelligence all-star in us all. Whether you’re new to the business intelligence league, have recently been transferred to a new team, or are just looking to up your data game, here are some strategies that can help.

Practice Like You Play

While practice might not always make perfect, it helps you get a little closer in your continuous pursuit. Natural talent can only take you so far, making practice essential to developing skills and gaining experience. Try taking on an additional practice project dedicated to advancing your technical skills. This will ensure your improvement over time and allow you to experiment outside of the common workplace parameters of traditional methods and time constraints. 

You should begin by picking out your “play data.” However, it’s important to note that this shouldn’t be just any old data. Find data related to something that interests you, take inspiration from any personal hobbies you may have. This could range from anything such as your music listening activity, your local weather data, or even your fantasy football league. 

Practicing your skills with data you have a personal invested interest in will give you the opportunity to play and experiment with new techniques. This will also increase your chances of continuing these development efforts. These projects are also a great way to demonstrate your curiosity when it comes to data, which can be key when looking to get drafted by another organization.  

If you’re stuck on sparking an initial idea, try researching open-source data and see if anything catches your eye. Resources like the Registry of Open Data on AWS or the U.S. government’s open data library are great places to start.

You can also see Inzata’s guide on Where to Get Free Public Datasets for Data Analytics Experimentation.

Learn From the Pros

Regardless of how much time you’ve spent in the league so far, there will always be more to learn from those around you. Taking the student approach or possessing the rookie mindset is vital to continuous learning. 

Start by looking to those who have demonstrated success in their field. This can be anyone from the higher-ups within your organization to an industry influencer. You can develop these connections by asking an executive to lunch or joining various discussion forums and networking groups.

Additionally, try attending as many training’s, webinars, and conferences as you can. These virtual events are more accessible than ever due to the recent widespread transition to remote work, giving you access to thought leaders across the globe.

There is also an abundance of available content online such as books and online courses. These resources will give you instant access to decades of industry experience and valuable lessons learned through hands-on accounts.

What’s Your Next Home Run?

Your batting average when it comes to tasks and projects is crucial to long term success. You might get lucky every once in a while if you’re aimlessly swinging for the fences. It’s important, though, to make sure you are establishing attainable goals for yourself. You can think of these goals as the next home run you’re looking to hit. Having a clear vision of professional milestones will help guide you in the right direction and ultimately increase your chances of achievement. 

Studies show that you’re 42% more likely to achieve your goals if you simply write them down.

One strategy that will improve your batting average is to determine SMART goals for yourself in terms of your role and what you’d like to achieve. Now, these goals aren’t just smart in the traditional sense of the word. 

SMART is an acronym for:

  • Specific – Make your goals clear and concise. Don’t leave any room for ambiguity or confusion, these goals should be as specific as possible.
  • Measurable – Evaluation is essential. You need to be able to measure your advancement towards your goal through metrics or other methods. How will you measure your progress? What metrics or evidence will you track in order to assess your efforts? 
  • Achievable – Make sure you aren’t setting goals outside of your reach. While these goals should be challenging, it’s important to remain within the realm of attainability.
  • Relevant – Your goals should be tied to the broader goals of your organization and what your department is trying to achieve. 
  • Time-Based – Setting a timeline will help you manage your time and implement a sense of urgency into your efforts.

This strategy is effective in that it sets up clear and measurable targets, increasing your chances of knocking a project or metric out of the park. 

Your goals should be challenging enough so that you won’t be able to hit one every game and it’s by no means comparable to winning your organization’s world series, but it’s a small win helping to mark your development as a player. 

Around the Bases

Overall, this post demonstrates the many tactics and resources available at anyone’s disposal to immediately up your data game. Finding the BI all-star in you ultimately comes down to how you’re investing in yourself. Improvement is a slow and steady process, make the most of the knowledge around you and experiment with what interests you. Implement these tips and strategies to start your journey to the hall of fame!

Categories
BI Best Practices Business Intelligence Data Analytics

How to Transform Your Lazy BI Team

Are lazy BI practices getting the best of your team? It’s not uncommon for teams to become entrenched in their usual way of doing things, particularly when repeatable and seemingly mundane tasks are involved. There is always an opportunity for growth and process improvement in any team, but a case of lazy BI can make any new methods or change difficult to implement. 

If you’re looking to ignite change, don’t worry, best practices are always here to lend a hand with everything from data sources to server management. Whether you’re dealing with the self-taught BI wizard of the team or just a tired coworker, here are some strategies that can help. 

If You’re New to the Team

Before we jump into strategies, if you’re in the unique situation of being new to the team, there are a few things you should keep in mind. Though it might be easier for you to see where improvements need to be made as an outside source, it’s important to establish rapport with your teammates before rushing to make changes. 

Begin by observing and make note of potential adjustments to workflows or processes. Additionally, be inquisitive and ask questions to figure out the why behind methods that aren’t considered to be best practice. After you’ve allowed some time to get a feel for the entirety of the situation, consider these methods when developing your approach. 

Why Change if Nothing’s Broken?

Why should you do things differently if your current methods are getting the job done? Don’t be surprised if you receive the ‘if it ain’t broke, don’t fix it’ mentality in response. This is a common and natural resistance to changes proposed, the way you go about bringing people on board is essential.

Use the Laziness to Your Advantage

It’s not uncommon for new processes or best practices to be swept under the rug following their initial introduction. While new ways of doing things might be more efficient and a good idea on paper, no change can survive without successful adoption from the majority.

The key is appealing to less work and effort exerted in the future. Even though it might take time to adjust and create increased work for your team initially, it’s important to emphasize the mass amounts of time they will save in the future.

In this approach, you’ll be responding to the age-old question of “what’s in it for me?” 

Though best practices are better for productivity and the organization as a whole, how will these changes directly benefit those involved? Appealing to the desire at an individual level will increase your chances of successful implementation.

Start Small

The key to any kind of change is to start small. Upheaving the old methods to make way for new ones is extremely disruptive and can be overwhelming to most. Starting small will increase your chances of a successful adoption.

Find something small your team can achieve or begin to change. This is the same philosophy people use when altering their life by doing something as simple as making your bed each day. Though it is a small task, it helps those involved to feel accomplished. This makes one more likely to be productive elsewhere in their day as well as being open to greater change.

Conclusion

Overall, it’s important to remember that there is no ironclad rule or gold standard for the successful adoption of new methods. There is no absolute anecdote or cure to a case of lazy BI. Regardless of which strategies or tactics you’re using to influence change, every team is different in the way they learn and adapt. Each scenario bears its own unique characteristics in terms of behavior, environment, and the topic of change itself. As a leader and a teammate, it’s up to you to access these factors and strategize your approach accordingly.

Categories
Artificial Intelligence Big Data Business Intelligence Data Analytics

Press Release: Inzata Analytics: Expanding its Reach to the DoD with Nobletech Solutions

Inzata Analytics, a data analytics software company, has announced its partnership with Nobletech Solutions Inc., a provider of technology and engineering services. This partnership will address the DoD’s full spectrum of data challenges ranging from prognostic & predictive maintenance (PPMx), logistics, and sustainment to intelligence, human resources, and fiscal management without the complexity and delays that existing DoD data analytics tools provide.

Inzata provides the software to bring data analytics to end-users within hours and days at all levels within DoD organizations, regardless of user-level experience. Nobletech provides the proper secure network, DoD experience, and contract vehicles that will put Inzata’s AI and data analytics solutions into the hands of those front-line users when the data is needed to make those critical decisions.

Inzata’s ability to assemble large disparate data sources without coding enables data analysis to occur in significantly shorter times than any of its competitors. The current political climate cannot afford to wait months and years for analysts and data architects to develop products for decision makers while Inzata’s AI/ML and no-code solution can have it done in days and weeks, vs. months and years that the competition requires.

Nobletech Solutions will bring Inzata into the DoD by leveraging their GSA Schedule while pursuing a DoD Enterprise Software Agreement (ESA). This will be done by demonstrating to the DoD and its industry partners the power of Inzata’s Artificial Intelligence/Machine Learning (AI/ML) capability to perform rapid assembly and analysis of data and visual dashboards through its unique no-code solutions.

It is certain that Nobletech Solutions with the ability to host on the DoD secret cloud, without the required add-ins and extras required by those other data analytics platforms, will surely be a significant mission enabler to special operations and other organizations within the DoD and OGA.

Nobletech Sr. Analyst: “Providing an edge to the DoD to quickly assemble large data with the help of AI/ML will certainly be a game changer. We envision Inzata as the tool to provide that big picture view of people, equipment, parts, location, training, intelligence, risk, environmental conditions, and other data needed by the most senior level commanders down to the small unit leader.”

Nobletech CEO: “We are excited to have this partnership and look forward to being a key player in meeting the needs of DoD’s data analytics pertaining to human resource, material, training/qualification, prognostic maintenance, and intelligence.”

For more information, please contact the following:
Jim Scala at jscala@nobletechsolutions.com
Luke Whittington at lwhittington@nobletechsolutions.com
You can also learn more by visiting https://www.nobletechsolutions.com/data-analytics

This press release was originally featured on PRWeb, find the press release here: http://www.prweb.com/releases/inzata_analytics_expanding_its_reach_to_the_dod_with_nobletech_solutions

Categories
Big Data Business Intelligence Data Analytics

How to Effectively Leverage Data Wrapping

What Is Data Wrapping?

Data wrapping is a strategy utilized by many leading companies to create higher profit margins on data they’ve obtained. Originally coined by a scientist at MIT, it involves “wrapping” tools with relevant data to boost its overall value. These tools can be B2B tools or consumer-facing ones. Examples include user dashboards that already contain a user’s interests or have data that will allow artificial intelligence to more easily determine the characteristics of users. 

Only recently has data wrapping begun to be incorporated into commercial products. Though data and tools have certainly been sold independently for decades, this combination is novel. Though the joint use of the two was initially only intended for business to business or “B2B” programs, some consumer-facing portals have ended up using it, as well.

Who Came Up With Data Wrapping?

The MIT Center for Information Systems Research often publishes ideas for people and companies to better monetize their data. A research scientist working for this agency coined the term. Once they had defined it well and come up with a way to explain it to the public, the Center published a blog post about the practice here.

Why Is Data Wrapping Important?

The idea of simply rolling existing consumer data in with existing business analytics tools might seem obvious. After all, these tools are meant to take data in, process it in a meaningful way for a business, and put out reports based on the data. Though it’s likely that some companies already were informally performing this to further monetize products, the fact that a prominent institution coined this term carries weight.

Now that it’s formally recognized as a legitimate profit strategy, more firms are likely to adopt this model, specifically when developing software. It also signals the end of the “products for people” era of open-source software and ushers in the “Information Age” once and for all. Unlike much of software development, which focuses on the end-user and what they want in products, data wrapping focuses exclusively on improving internal business processes. Some companies have had ethical questions regarding data wrapping and even legal questions surrounding its influence, but the MIT publication attempts to answer some of these questions.

This isn’t to say that businesses haven’t utilized data wrapping to help their customers harness its power, though. For example, a prominent bank in 2016 took advantage of data wrapping to allow consumers to see all of their spending inside their bank portal. All of their credit card, loan, and bank account transactions could be seen in one spot. This simplification of finances makes it far easier for the average person to find success in the personal finance domain. As one of the first customer-facing uses of data wrapping in 2016, many other corporations followed suit, and this is now almost standard in the banking world.

How Do Organizations Leverage Data Wrapping Today?

Since around 2016, organizations have been trying to figure out how to maximize profits through leveraging data wrapping. These companies can make a cross-sectional team of people from their IT departments, acquisitions groups, and analytics groups within their companies. 

These groups should then consider the needs of their business as well as their customers. We see this portrayed through the example of the all-inclusive banking portal. The bank foresaw customer utility in creating a compiled analytics dashboard for consumers.

The next step is internal implementation. This involves engineers and creative teams making pilot versions of these ideas. They should then be tested by the intended target audience. User experience feedback should then be harvested by the company to determine which data wrapping ideas hold the most promise.

Data wrapping has immense potential in the corporate world and has remained a game-changer when it comes to increasing the bottom line. Data science and software engineering intersect at just the right point to create yet more value in the world of technology and information.

Categories
Big Data Business Intelligence Data Analytics

Why You Need to Modernize Your Data Platform

Effective use of data has become more important to modern businesses than many could have imagined a decade ago. As a piece on why every company needs a data strategy back in 2019 put it, data now “matters to any company” and is “one of our biggest business assets” in the modern environment. These are indisputable statements at this point, and they’re why every business hoping to succeed today needs to modernize its data platform (if it hasn’t already).

That said, even among those who like the idea of embracing data, many don’t quite understand what modernizing means in this sense. In this piece, we’ll look at why this needs to be done, who needs to do it, and what, ultimately, the process entails.

Why Modernize Data?

In very general terms, we addressed the why above: Effective data usage is indisputably one of the greatest assets available to businesses today. More specifically though, the role of data in business comes down to insight across various departments and operations. A robust data operation allows companies to understand needs and develop detailed processes for hiring; it enables marketing departments to make more targeted and fruitful efforts, and it helps management to recognize internal trends that drive or detract from productivity, and act accordingly. Modern data essentially streamlines business and makes it more efficient across the board.

We would also add that for smaller businesses, the why comes down to competition. The democratization of data in modern times is giving smaller companies the means to match larger competitors in certain efforts, and thus giving them a chance to keep pace.

Who Modernizes Data?

The answer to who brings about data modernization within a company will vary depending on the size and resources of the company at hand. For smaller businesses or those with particularly limited resources, it is possible to make this change internally. Much of the data modernization process comes down to using tech tools that can gather and catalog information in a largely automated fashion.

At the same time though, companies with more resources should consider that data analytics is a field on the rise, and one producing legions of young, educated people seeking work. Today, countless individuals are seeking an online master’s in data analytics specifically on the grounds that the business data analytics industry is in the midst of a projected 13.2% compound annual growth rate through 2022. Jobs in the field are on the rise, meaning this has become a significant market. This is all to say that it’s reasonable at this point for businesses seeking to modernize their data operations to hire trained professionals specifically for this work.

What Should Be Done?

This is perhaps the biggest question, and it depends largely on what a given business entails. For instance, for businesses that involve a focus on direct purchases from customers, data modernization should focus on how to glean more information at the point of sale, build customer profiles, and ultimately turn advertising into a targeted, data-driven effort. Businesses with large-scale logistics operations should direct data improvement efforts toward optimizing the supply chain, as Inzata has discussed before.

Across almost every business though, there should be fundamental efforts to collect and organize more information with respect to internal productivity, company finances, and marketing. These are areas in which there are always benefits to more sophisticated data, and they can form the foundation of a modernized effort that ultimately branches out into more specific needs. 

At that point, a business will be taking full advantage of these invaluable ideas and processes.  

Written by Althea Collins for Inzata Analytics

Categories
Big Data Business Intelligence Data Analytics

Is Big Data the Key to Optimizing the Supply Chain?

One of the biggest challenges facing many companies is figuring out how to optimize their supply chains. For obvious reasons, they want to strike a balance between keeping costs down and making sure they have the resources required to continue to operate. As became evident during the early months of the COVID-19 outbreak, supply chains, especially global ones, can be tricky beasts to tame.

Maintaining the right balance between efficiency and resilience is challenging even in the best of economies. One solution many enterprises now use to stay nimble in the face of evolving circumstances is Big Data. 

By using computing power, algorithms, statistical methods, and artificial intelligence (AI), a company can condense the massive amount of available information about supply chains into comprehensible insights. That means making decisions quickly and without sacrificing optimization or resiliency. Let’s take a closer look at this trend and what it might mean for your operations.

What Can Big Data Do?

Computing resources can be focused on a handful of supply chain-related issues. These include jobs like:

  • Forecasting supply and demand
  • Proactive maintenance of infrastructure elements like warehouses and transportation
  • Determining how to best stow freight
  • Making pricing and ordering decisions
  • Inspecting items and identifying defects
  • Deploying workforce members, such as dockworkers and truck drivers, more efficiently

Suppose you run a consumer paper products company. You may need to scour the world for the best total price for a wood sourcing shipment. This may mean using Big Data systems to collect information about prices down the road and halfway across the world. Likewise, the company would need to make decisions about whether the costs of transporting and storing the wood pulp would be effective. Similarly, they’d need to establish confidence that each shipment would arrive on time.

How to Build the Needed Big Data Resources

First, it’s critical to understand that taking advantage of big data is about more than just putting a bunch of machines to work. A culture needs to be established from the top down at any organization. This culture has to:

  • Value data and insights
  • Understand how to convert insights into actions
  • Have access to resources like data pools, dashboards, and databases that enable their work
  • Stay committed to a continuous process of improvement

A company needs data scientists and analysts just as much as it needs computing power. C-level executives need to be onboarded with the culture, and they need to come to value data so much that checking the dashboards, whether it be on their phones or at their desk, is a routine part of their duties. Folks involved with buying, selling, transporting, and handling items need to know why supplies are dealt with in a particular way.

In addition to building a culture, team members have to have the right tools. This means computer software and hardware that can process massive amounts of data, turn it into analysis, and deliver the analysis as insights in the form of reports, presentations, and dashboards. Computing power can be derived from a variety of sources, including servers, cloud-based architectures, and even CPUs and GPUs on individual machines. 

Some companies even have embraced edge intelligence. This involves using numerous small devices and tags to track granular data in the field, at the edge of where data gathering begins. For example, edge intelligence can be used to track the conditions of crops. Companies in the food services industries can then use this data to run predictive analysis regarding what the supply chain will look like by harvest time.

What Are the Benefits?

Companies can gain a number of benefits from embracing Big Data as part of their supply chain analysis. By studying markets more broadly, they can reduce costs by finding suppliers that offer better rates. Predictive systems allow them to stock up on key supplies before a crunch hits or let slack out when the market is oversupplied. Tracking customer trends makes it easier to ramp up buying to meet emerging demand, driving greater profits.

Developing Big Data operations separates good businesses from great ones. With a more data-driven understanding of the supply chain, your operation can begin finding opportunities rather than reacting to events. By putting Big Data resources in place, supply chain processes can become more optimized and resilient.

Polk County Schools Case Study in Data Analytics

We’ll send it to your inbox immediately!

Polk County Case Study for Data Analytics Inzata Platform in School Districts

Get Your Guide

We’ll send it to your inbox immediately!

Guide to Cleaning Data with Excel & Google Sheets Book Cover by Inzata COO Christopher Rafter