Categories
Big Data Data Analytics Data Enrichment Data Quality

5 Common Challenges of Data Integration (And How to Overcome Them)

Big data is a giant industry that generates billions in annual profits. By extension, data integration is an essential process in which every company should invest. Businesses that leverage available data enjoy exponential gains.

What is Data Integration?

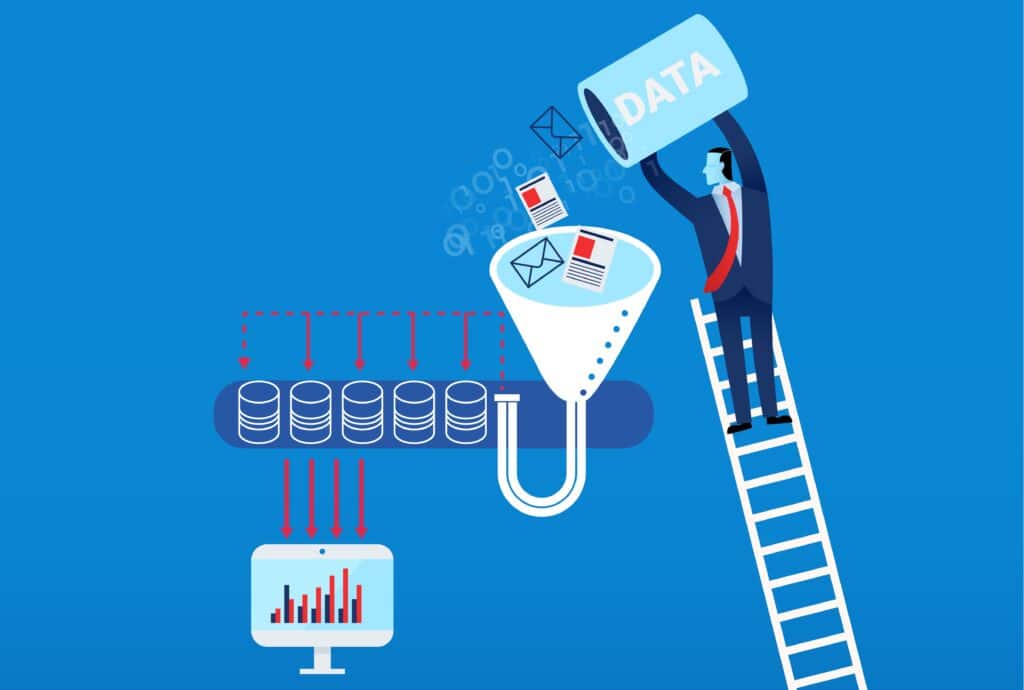
Data integration is the process of gathering and merging information from various sources into one system. The goal is to direct all information into a central location, which requires:

  • On-boarding the data
  • Cleansing the information
  • ETL mapping
  • Transforming and depositing individual data pieces

Five Common Data Integration Problems

Getting a data integration process purring like a finely tuned Ferrari takes expertise, and the people running your system should intimately understand the five most common problems in an informational pipeline.

#1: Variable Data From Disparate Sources

Every nanosecond, countless bytes of data are moving rapidly around the ether — and uniformity isn’t a requirement. As a result, the informational gateway of any database or warehouse is a bit chaotic. Before data can be released into the system, it needs to be checked in, cleaned, and properly dressed.

#2: The Data/Security Conundrum

One of the most challenging aspects of maintaining a high-functioning data pipeline is determining the perfect balance between access and security. Making all files available to everyone isn’t wise. However, the people who need it should have it. When departments are siloed and have access to different data, inefficiencies frequently arise. 

#3: Low-Quality Information

A database is only as good as its data. If junk goes in, then waste comes out. Preventing your system from turning into an informational landfill requires scrubbing your data sets of dreck.

#4: Bad Integration Software

Even if your data shines like the top of the Chrysler Building, clunky data integration software can cause significant issues. For example, are you deploying trigger-based solutions that don’t account for helpful historical data?

#5: Too Much Useless Data

When collected thoughtfully and integrated seamlessly, data is incredibly valuable. But data hoarding is a resource succubus. Think about the homes of hoarders. Often, there’s so much garbage lying around that it’s impossible to find the “good” stuff. The same logic applies to databases and warehouses.

What Are Standard Data Integration Best Practices?

Ensuring a business doesn’t fall victim to the five pitfalls of data integration requires strict protocols and constant maintenance. Standard best practices include:

  • Surveillance: Before accepting a new data source, due diligence is key! Vet third-party vendors to ensure their data is legitimate.
  • Cleaning: When information first hits the pipeline, it should be scrubbed of duplicates and scanned for invalid data.
  • Document and Distribute: Invest in database documentation! Too many companies skip this step, and their informational pipelines crumble within months.
  • Back it Up: The world is a chaotic place. Anomalies happen all the time — as do mistakes. So back up data in the event of mishaps.
  • Get Help: Enlist the help of data integration experts to ensure proper software setups and protocol standards.

Data Integration Expertise and Assistance

Is your business leveraging its data? Is your informational pipeline making money or wasting it? If you can’t answer these questions confidently and want to explore options, reach out to Inzata Analytics. Our team of data integration experts can do a 360-degree interrogation of your current setup, identify weak links, and outline solutions that will allow you to move forward more productively and profitably.

Categories
Big Data Data Analytics Data Enrichment

Where to Get Free Public Datasets for Data Analytics Experimentation

Many data companies believe that they have to create their own datasets in order to see the benefits of data analytics, but this is far from the truth. There are hundreds of thousands of free datasets on the internet that anyone can access completely free. These datasets can be useful for anyone who is looking to learn how to analyze data, create data visualizations, or just improve their data literacy skills.

Data.gov

In 2015, the United States Government pledged to make all government data available for free online. Data.gov allows you to search over 200 thousand datasets from a variety of sources and pertaining to many different topics. They offer datasets about Agriculture, Finances, Public Safety, Education, The Environment, Energy, and many other topics that span over a wide range of subjects.

Google Trends

With Google Trends, users are able to find search term data on any topic in the world. You can check how often people google your company, and you can even download the datasets for analysis in another program. Google offers a wide variety of filters, allowing you to narrow down your search by location, time ranges, categories, or even specific search types (ex. Image or video results).

Amazon Web Services Open Data Registry


Amazon offers just over 100 datasets for public use, covering a wide range of topics, such as an encyclopedia of DNA elements, Satellite data, and Trip data from Taxis and Limousines in New York City. Amazon also includes “usage examples” where they provide links to work that other organizations and groups have done with the data.

Data.gov.uk

Just like the United States, The United Kingdom posts all of their data for public use free of charge. This is also the case with lots of other countries such as Singapore, Australia, and India. With so many countries offering their data to the public, it shouldn’t be hard to find a good data set to experiment with.

Pew Internet

The Pew Research Center’s mission is to collect and analyze data from all over the world. They cover all sorts of topics like journalism, religion, politics, the economy, online privacy, social media, and demographic trends. They are nonprofit, nonpartisan and nonadvocacy. While they do their own work with the data they collect, they also offer it to the public for further analysis. To gain access to the data, all you need to do is register for a free account, and credit Pew Research Center as the source for the data.

Reddit Comments

reddit datasetsSome members of r/datasets on Reddit have released a dataset of all comments on the site dating back to 2005. The datasets are categorized by year and are available to download for free by anyone and it could be a fun project to analyze the data and see what could be discovered about reddit commenters.

Earthdata

Another great source for datasets is Earthdata, which is a part of NASA’s Earth Science Data Systems Program. Its purpose is to process and record Earth Science data from Aircraft, Satellites, and field measurements.

UNICEF

UNICEF’s data page is a great source for data sets that relate to nutrition, development, education, diseases, gender equality, immunization and other issues relating to women and children. They have about 40 datasets open to the public.

National Climatic Data Center

The National Climatic Data Center is the largest archive of environmental data in the world. Here you can find an archive of weather and climate data sets from all around the United States. The National Climatic Data Center also has meteorological, geophysical, atmospheric, and oceanic data sets.

Read More Here

Categories
Big Data Data Analytics Data Enrichment Data Monetization

The Immense Value Behind Data Enrichment with Secondary Data

Techopedia defines data enrichment as “processes used to enhance, refine or otherwise improve raw data.” Raw data is just the seed, and data enrichment is the light needed to grow it into a strong, useful, and valuable mechanism for your business.

Ultimately, the goal of data enrichment is to boost the data that you are currently storing with secondary data. Whether it is at the point of capture or after the data is accumulated, adding insights from reliable information sources is where the real value is gained. In other words, data enrichment is journey of transforming your raw, commodity data into a true asset to your organization, project, or research.

Refining raw data should include the following steps:

  • Removing errors such as null or duplicate values
  • Using data profiling to clarify the content, relationships, and structure of the data
  • Improving the data quality overall to increase its reliability and analytical value
  • Strategically adding additional attributes, relationships, and details that uncover new insights around your customers, operations, and competition from secondary data

Data refinement avoids the negative outcomes of attempting to work with bad data. Low quality data can have serious negative impacts on your project. It can needlessly increase costs, waste precious time, cripple important decision making, and even anger clients or customers.

During or after the refinement of your data, enriching it with advanced data dimensions such as detailed time frames, geography details, weather history, and even a wide variety of customer demographics from multiple secondary data libraries is key to unleashing its true value to your company, customers, and shareholders.

  • What if you could predict which clients are most likely to buy, and exactly how much they will spend, just from their initial lead profile?
  • What if you could identify the key success characteristics of a new market or store location, just from viewing the demographics of the area?
  • How much easier would day-to-day decisions become if you could consider all of the factors involved, instead of just a few?

You will acquire a better and more complete understanding of your prospects and target market. You will learn more about your market by appending business information to the records that you capture and store, pinpointing key sociodemographic groups of business prospects, or improving efficiencies across your business units.

Most would agree that data enrichment with secondary data is valuable, but why do less than 10% of companies do it? The simplest answer is “it’s hard.” It’s time consuming and labor-intensive to gather and maintain all of these various enrichments. It’s hard to thread and blend data together AND keep it all accurate and organized. Let’s face it, most business professionals barely have time to analyze the data in front of them, much less go out and find other sources.

Let’s Talk About Inzata

Inzata is a data analytics platform designed to change all of that. Inzata offers a growing list of more than 25 separate enrichments, ranging from things like geospatial and location enrichments, to weather data and advanced customer demographics down with street level accuracy.

Data enrichment is a core function with Inzata, it’s designed as an integral part of our Agile AnalyticsTM, the workflow that uses technology to turn raw data into digital gold. 

Secondary data is the key concept of data enrichment, such as advanced customer demographics, which is arguably the strongest data enrichment a company could use to add an immense amount of value to their customer data. Unlike any other data analytics platform, Inzata has over 150 customer demographics from the entire nation built right into the platform for one-click access at all times. Some of these enrichments include:

  • Income brackets
  • Employment
  • Occupation
  • Housing occupant/valuation
  • Marital Status
  • Education level
  • Industry facts

Enriching your customer data in this way greatly increases the value and precision of your analysis, and allow you to answer much more complex questions about your business. Inzata makes enriching your data as simple as selecting which attributes you want to add, and instantly adding them to your data.

These enrichments are absolutely priceless for companies with big data on their hands. Being able to slice and dice your large datasets by these detailed demographics and behavioral characteristics makes them more precise, more manageable, and better able to tell you what’s actually going on inside your business. Think of enrichment as a force-multiplier for your big data initiative. Knowing more about your customers, your transactions. Failing to enrich a mass amount of simple customer data for your own benefit is like choosing a 2005 flip-phone over a 2018 smartphone.

A Harvard Business Review1 article mentions two very important statistics that easily prove why data enrichment is absolutely crucial:

  • On average, 47% of newly created data records have at least one critical & work-impacting error.
  • Only 3% of the data quality scores in their study can be rated “acceptable” using the loosest-possible standard.

Any business can easily avoid falling into these negative statistics by investing in the correct data analytics platform that provides powerful enrichments for top-notch data refinement and enhancement through a variety of secondary data sources.

Inzata’s platform is the first and only of its kind to include one-click enrichments for any data, from any source, for any business. Stay ahead of the curve in data analytics and invest in the best, invest in Inzata.

Sources

1Only 3% of Companies’ Data Meets Basic Quality Standards, https://hbr.org/2017/09/only-3-of-companies-data-meets-basic-quality-standards

Categories
Big Data Data Enrichment Data Monetization

The Chief Data Monetization Officer: Turn Big Data into Profit

Humans produce around 2.5 quintillion bytes of data daily. However, over 90% of data collected is never read or analyzed. Data monetization is the process of putting your data to work, resulting in economic benefit.

In many businesses, the amount of data that goes unanalyzed is much higher, approaching 100%. We’re spending millions to collect and store this resource, but we’re only putting a tenth of it to practical use. That’s like finding a massive oil deposit underground, and just pumping the crude up to the surface and storing it in huge tanks.

So the problem is not that there isn’t enough data. We have plenty of data, and exceedingly good at collecting and making more.

The problem is one of refinement and distribution. Monetizing oil requires refineries, trucks and gasoline stations to get it to market. Without those, the oil is worthless.

Big Data is not of much value unless it’s driving profit and positive change in the enterprise. Once you’ve figured out how to do that, its value skyrockets.

The one big difference between data and oil is that you can only refine oil into a product once, then it’s gone. Data stays around. You can keep monetizing the same data over and over by refining it, analyzing it, combining it, and produce valuable new assets over and over.

The right insights at the right time can be priceless. They can save lives, avert disasters, and help us achieve incredible outcomes.

Great data projects start with great questions. Not “interesting” or “nice to have” questions, but truly great questions that, when answered, will visibly move the needle on the business.

Unfortunately, most business leaders aren’t used to walking around the office asking impossible questions that seemingly no one can answer. But that’s exactly what I encourage them to do.

The most valuable person at the start of any Big Data project is the person who understands what’s possible with Data Monetization. It takes vision, and their confidence gives others the courage to ask the hard questions.

It’s not enough to just collect and work with data. The questions don’t come from the data, the answers do. It’s your job to come up with the best questions.

Organizations across all industries have large volumes of data that could be used to answer consumer and business questions or drive dta monetization strategies.

This requires a skill many organizations have yet to develop. To get the maximum economic value from data monetization, organizations should shift their emphasis from Chief Data Officers, or CDOs, to Data Monetization Officers.

Low-cost BI analytical platforms are revolutionizing the way the world makes decisions. A bold claim? Not really. To help us examine the impact of widely used BI platforms with Big Data will have, let us describe how the information sharing and data monetization process works.

Chief Data Officers typically come from an IT background and report to the CIO. A DMO comes from a business background and understands how the business functions the way a COO or CFO would. They’re tasked with using data to provide direct, measurable benefits to the business. Their job is to monetize the company’s information assets. They have an inclination toward revenue growth and are skilled in finding new data monetization revenue opportunities and customers.

The DMO has a strong affinity for measurement. This shouldn’t be much of a stretch for someone with “data” in their job title, but they need to be willing to apply it to themselves as often as necessary. They need to be picky in choosing the truly “great ideas” for data monetization. They need to resist the ones that won’t improve business performance, no matter how neat they sound.

Smart organizations understand the benefits of having someone focusing on extracting business value from data and charting ata monetization strategy.

By 2022, most companies will have a specialized resource, or DMO, in charge of managing and monetizing the company’s most valuable asset: its data.

If you’re reading this thinking “We don’t have enough data to justify this kind of role,” Think again. Most companies already have more than enough data to make an initiative like this worthwhile.

I’d love to know what you think.

Would your company benefit from someone in charge of managing the ROI of data?

Could dataetization change the way you look at your data, and possibly create opportunity for profits?

How effective is your organization at leveraging data and analytics to power your business?

Are you a candidate for this type of role?

  • Do you understand your organizations key business initiatives and what data reflects how they are doing? Do you understand and track leading success?
  • Can you estimate the economic value of your data both inside and outside of your company?
  • Do you have the skills and tools to exploit this economic value?

Learn more about Inzata, the first Analytics platform designed for Data Monetization.

Polk County Schools Case Study in Data Analytics

We’ll send it to your inbox immediately!

Polk County Case Study for Data Analytics Inzata Platform in School Districts

Get Your Guide

We’ll send it to your inbox immediately!

Guide to Cleaning Data with Excel & Google Sheets Book Cover by Inzata COO Christopher Rafter