Categories
Business Intelligence Data Analytics Data Visualization

How to Avoid the 5 Most Common Data Visualization Mistakes

Why Do Data Visualization Mistakes Matter?

Although data visualization has been in place since 1780, when the first bar chart was produced by a toy company in Scotland, the practice is still imperfect. Both intentional, misleading data visualization “mistakes” as well as honest mistakes made during output are more common in the business world than one might think.

Intentional “Errors”

When an organization wants to get a point across without providing much evidence, “statistical manipulation” is commonplace. Though a dishonest practice, it’s still widely seen in business today. Typically, organizations will leave out the scale on a bar graph or pie chart. Then, they will intentionally emphasize disparities or relationships in the data, with no actual scale to which viewers can compare each bar.

Virtually any data set can be made to look off-target using this method. While experienced analysts would be able to question or see right past this type of reporting, individuals unfamiliar with the data may not. As a side effect, this manipulation and bias could lead to a loss of credibility or potential revenue.

Unintentional Errors

The “weakest link” in the chain of statistical reporting is often the human generating the report. Even if there’s no reason for the person making the report to be misleading, their reports could unintentionally appear this way. Most often due to a lack of experience or context on the matter, these mistakes look deceiving and can result in a loss of integrity.

Who is Responsible for These Mistakes?

Most organizations have several layers of employees. While a report may be generated by an individual analyst, the responsibility for its contents is typically on the department that ends up releasing it. 

It can be hard to take a step back and think objectively when you’re the one working so closely with the data. This is why it’s critical to get multiple perspectives on the veracity of your reports before releasing them. Alternatively, you may choose to train an internal department that reviews every data set before it’s released to the public or another company.

What Are the Five Most Common Mistakes?

While there is an abundance of potential mistakes that could occur during the creation of a data set, some are more common than others. Here are the five issues we see the most often when it comes to data visualizations. They are important to avoid as all of these can be harmful to a company’s reputation and credibility overall.

1. Unlabeled X-Axis Start

A common technique in intentional data distortion, this is an abuse of the common conclusion that readers would draw from your chart. Unless otherwise marked, readers assume that your X-axes start at 0. Starting them at a higher number to emphasize smaller disparities is beyond merely “tweaking” a chart.

2. An Inverted Y-Axis

Elementary school-level math taught most of us that our X-axis and Y-axis should start at zero and go up from there. If an analyst wants to convey a message that’s the opposite of the results, flipping an axis is a great way to do that. However, this method rarely pays off due to the irregular visualization. Experienced viewers will undoubtedly detect this. 

3. Scale Truncation

We all expect bar charts to be linear in nature. However, if someone generating the chart wants a number to appear lower than it actually is, truncating it is the way to go. This is when you might see a small squiggle in a bar chart that randomly cuts out a large number. Ostensibly, the reason is usually to “keep it all on one page.” However, simply changing the scale rather than truncating arbitrary columns is how to keep it honest.

4. Cherry-Picking Scales

This is when a chart has data in arbitrary units. These are typically (but not always) intentionally engineered to make two scales either as close to each other as possible or as far away from each other as possible. It’s important to use the same units wherever possible. If it’s not possible, this must be clearly distinguished.

5. Including Too Much Data

Not always done intentionally but confusing nonetheless, this is when a chart has far too much data for the average reader to interpret. Charts should be kept as simple as possible. This will allow viewers to quickly and easily understand the information presented. 
Categories
Business Intelligence Data Visualization

4 Powerful Ways to Visualize Your Data (With Examples)

While visualizing data, all of us know about the pie chart or the line graph. These graphs are some of the most common and basic visualizations of data. However, these graphs are only the tip of the iceberg. There is a whole range of visualization methods that can be used to present data in the most effective manner.

Though the nearly endless possibilities lead to another issue, which one do you choose?

Exploring Some Common Visualizations

In this post, we will discuss some of the most common data visualizations and more specifically when they communicate your data clearly and when they don’t. Again, there are wide choices available, so we can’t cover them all, but the ideas presented can be applied to any visualization you come across in the future.

Line Chart

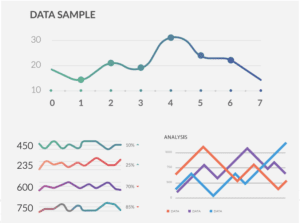
If there was an “old reliable” of the data visualization world, the line chart would be it. However, despite the old part being true, the reliable part should probably be up for debate. Line charts show one thing very well and that is numerical data combined with an ordinal attribute. 

graph

For example, transaction totals over time. That is due to the structure of the purpose of the line chart. At the end of the day, what the line chart is designed to show is how something moves from one ordinal data point to another. 

In cases where the data shouldn’t be connected in such a manner, all a line chart does is confuse the viewer. A line chart should only be used to communicate a maximum of 3-5 “lines” at a time, any more than this and the chart begins to feel crowded and look confusing. 

The two biggest offenders for bad line charts are too many variables (as seen to the right) or too high a frequency. Both of these mistakes cause a line chart to be confusing and hard to understand.

Gauge Visualization

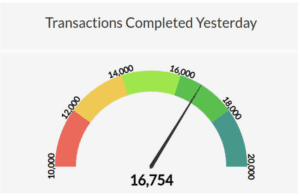
The needle gauge is an incredibly popular visual and has some strong benefits. 

We’ve been conditioned since we learned to drive to trust and love gauges. They are very efficient at showing a single numerical data value at a single point in time. People love their simplicity, but that’s also their weakness. 

graphA gauge is an exceptionally clear visual. It shows exactly where a number falls between a minimum value and maximum value. If you want to show how your sales performance was for a specific time period, a gauge will allow a user to instantly know if you did better or worse than expected.
However, this simplicity is also an issue for gauges and similar one-dimensional visualizations. It can only be used to show a single number, and it takes up a lot of room. That’s fine in a car dashboard, where you only care about a few key real-time metrics like speed, RPM, and engine temp. But on a business data dashboard, prime real estate is valuable. It is for that reason we like to use gauges sparingly.

map

Choropleth Map

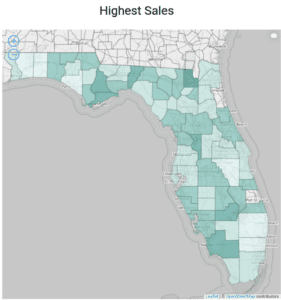
A choropleth, also known as a filled map, uses differences in shading or coloring within predefined areas to indicate the values or categories in those areas.

This is useful when you want to see what states you have the most sales in for example. These sorts of maps are very good at showing such distributions. However, they don’t have the granularity of other visualizations.

screen

Table

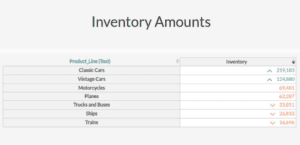
Yes, sometimes a simple table is the best way to show data. However, if a table is going to be used as part of a dashboard, it needs to be used properly. This means things like conditional formatting or in-depth filtering must be applied. 

table

The goal of a table in a dashboard should be just like the rest of these visualizations, to show something specific! It should be highlighting something like customers who have an outstanding balance. Do not fall into the trap of just showing the data again, otherwise, why did you spend time and money on visualizing your data at all?

Categories
Business Intelligence Data Visualization

7 Golden Rules for Dashboard Design

There are some important rules to follow when making dashboards and to ensure your dashboard hits the mark it needs to and gets people using it. Now let’s dive deeper into what makes a good dashboard.

1. Make sure you are designing the right dashboard for who is going to be using it

If you are going to spend your time and energy making a good dashboard you need to know who the dashboard has to be “good” for. Executives will want to see something different from a salesperson and so on for a data analyst, you need to know about the audience of the dashboard. The most effective dashboards are those which target a single user or group of users and then provide the right data and visualizations accordingly. A lot of people overlook this step, which creates havoc later on.

2. Display the dashboard data in a logical manner

Ensure that your data is displayed in logical groups, and in a proper manner. The top left-hand corner of your dashboard is where the eye will immediately go to and as such, it is the most important part of the dashboard. When we say to display the data in logical groups that is to say; if you are making an executive overview that compares two marketing strategies, the data for each strategy should be grouped together so that all of the visualizations for strategy A go on the left and all of the visualizations for strategy B go on the right.

3. Vary your visuals

When it comes to dashboards, variety is always better. Don’t use only one chart type, no matter how much you love stacked bars. Mix it up with straight lines and curves. Vary your report elements between low-level tables that show granular data and higher-level pie charts, gauges, and value widgets.

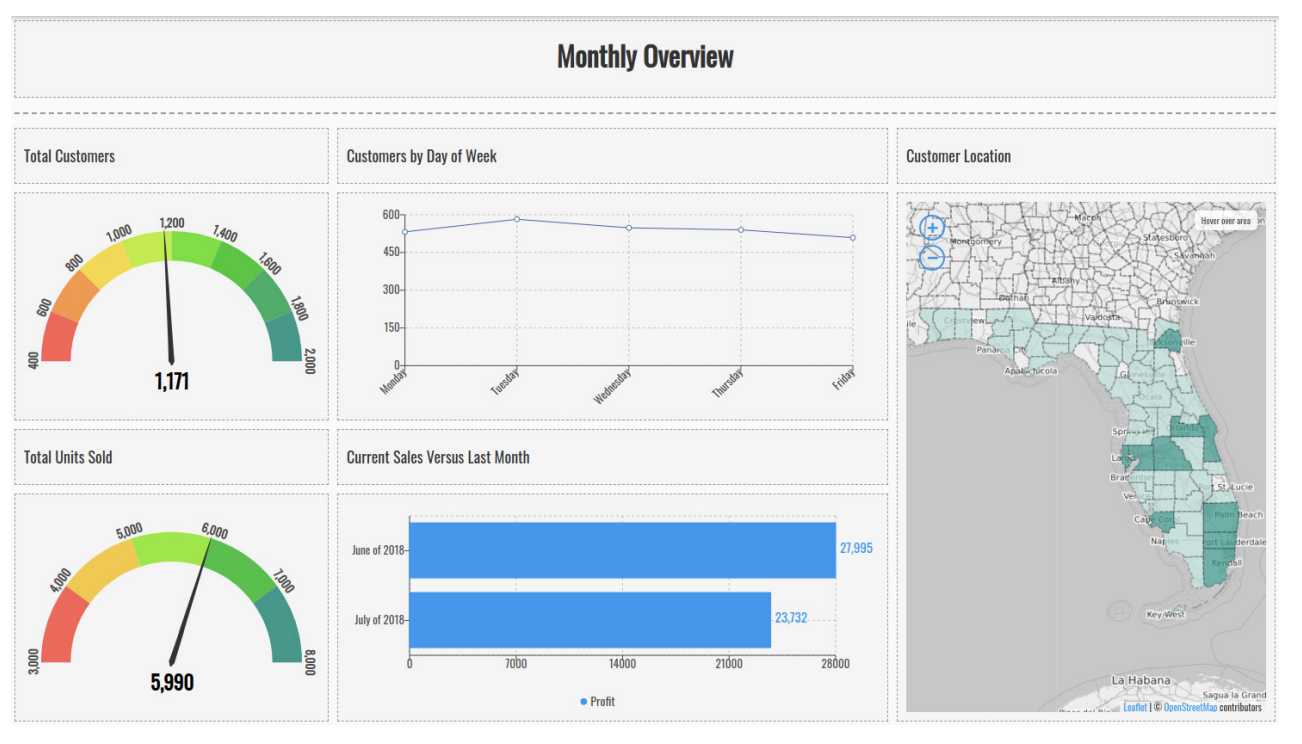
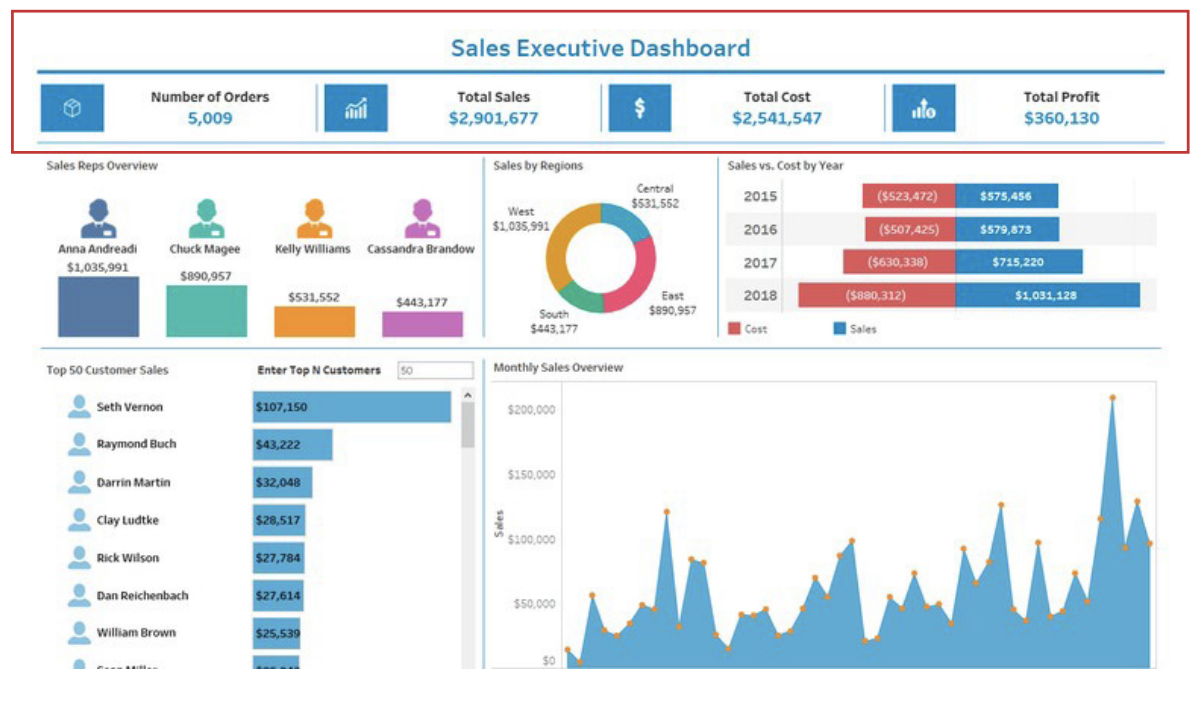
Here is an example of a good variety of visualizations for a monthly recap. It immediately shows the important totals as well as a comparison to last month and where our customers are coming from.

4. Locate the most important visuals “above the fold”

Above the fold is an old newspaper term, and it means the top part of the front page, which is still visible when the paper is folded. For dashboards, this means the screen real estate at the top is visible when the dashboard is first loaded by the user. Put your most important and/or summary level visuals at the top. Tools like Inzata (https://qastaging.wpengine.com) let you view heatmaps of how your users scroll and navigate within their dashboards. Use these to identify their most important and most-viewed elements and move them near the top.

5. Don’t forget your headline

You’re probably tired of all the newspaper references, but hey, there’s a reason why nearly every print newspaper on Earth is organized in more or less the same way: it’s effective.

What do headlines do? They communicate the main message to the reader about what happened or is happening. They’re in big, bold print so they’re hard to miss. We recommend using a nice row at the top consisting of 3 or 4 easy-to-spot widgets that are easy to read, like gauges or single-value widgets. This “headline” row quickly delivers key information to the viewer and sets the stage for further exploration as they continue reading.

6. Always refresh your data

Data that is being displayed on your dashboard only maintains importance if it is up to date. If you are trying to decide what to do tomorrow based on data from three months ago, you are going to arrive at the wrong conclusions.

7. Keep your dashboards focused!

Make sure that the most important data gets highlighted in the dashboard. You should also keep your dashboard small so that it is able to focus on the thing which is most important. Long dashboards aren’t always the best. Many small dashboards, which are focused on a single topic or goal, make a better dashboard than long and heavy ones.

Your dashboard should be focused on answering a single question and should almost never have more than five or six visualizations. It may be tempting to make one huge dashboard where someone could find all the answers, but that is not how people’s brains typically work. It will result in users feeling lost and confused because they can’t find what they need quickly. If it takes someone more than 5 seconds to find what they need on your dashboard, consider redesigning it.

Categories
Business Intelligence Data Visualization

What is Data Storytelling?

What is Data Storytelling?

How do you tell a GREAT story with data? 

Everyone likes hearing a good story. However, being asked to “tell a story” using data and visualization is often a big source of anxiety for analysts of all backgrounds.

An informal Twitter poll returned the following responses to the question “When I’m asked to show the data, I feel….”

Frustrated, because I don’t think I’ll tell the story effectively, and might miss important parts.

I feel pressure, pressured to make it clear for everyone, and what if people don’t like my story?

Inadequate, because I’m sure there are questions people will have that I haven’t anticipated.

Being able to tell stories with data is a skill that’s becoming ever more important in our world of increasing data and the desire for data‐driven decision-making. As more and more data visualizations are produced, they start to become a commodity and their quality suffers. This turns off viewers and people begin to rethink their investments. However, great Visual Storytelling can send the effectiveness and reach of your analysis through the roof and produce significant business influence, value, and career rewards.

Have a look at the graphic below. What story do you get from it? 


Here’s what most people see:

  1. The average surface temperature is trending higher.
  2. Multiple independent data sources all show the same trend, which lends further credibility.
  3. Temps were trending lower at one point, but that reversed and has started growing in lockstep with the rise of industrialization.

Even though it’s little more than a few words, numbers, and some colored lines, it tells a very compelling story, with strong supporting evidence, and makes its key points very persuasive.

Storytelling with data is no different than regular storytelling. Storytelling is by far the longest-running and most effective method of human-to-human knowledge transfer. The reason storytelling is so effective is that it engages emotions along with cognition (ability to learn). Emotion keeps you interested while you learn. 

  • Build Characters: First and foremost, stories involve characters. Without humanized characters, there’s nothing for the viewer to relate to; It’s not a story. Think about it. Every story you’ve ever read has human-like characters for you to relate to. Even movies and stories about animals and inanimate objects impart human characteristics to those characters: they talk, they react, they have expressions and emotions, they act human. In data, the character(s) can be you, or the reader, or named people, or people in a certain role, customers, employees. e.g. “Our Sales managers wanted to know how to ….” “I sought to uncover why ….” “Our CEO, Mike, asked me to investigate why ….” or even, “My daughter asked me about our company, and she wondered why X product was so successful….” A great way to introduce characters visually is with earlier Survey Results. The survey results let you introduce and describe characters, “Male employees, under 40, working in our US Offices had the following to say in a recent survey:” and also give them a voice.
  • “Use the Force, Luke”. The next thing that is required is some kind of goal, challenge, or objective. This line from Star Wars was Obi-Wan’s way of challenging Luke to learn the Jedi way and set out his hero’s journey. The characters must want or need to do something. That’s the hook. That’s what gets the reader to go along with the character, to put themselves in their shoes. In data, a great one here is answering a difficult question or solving a business problem. Even better would be showing how your insights and answers resulted in a measurable improvement. So give your characters a challenge to overcome. The bigger the challenge, the more interesting the story becomes because….. 
  • ….“Never Tell Me The Odds”: Give the character some stakes, some consequences of complete failure. Optional: Let the character fail, but use it to illustrate what they learned. Failure makes the stakes seem real and pulls the reader in even further. This is called “rising action”. Just don’t lay it on too thick.
  • Have a Point!“: Every story needs a climax, a point where the action peaks. This should involve being the main message you’re trying to communicate. It should always involve your character(s) achieving or exceeding their goal. For example, if your “challenge” was to use analysis in order to create a plan to change something, you can include a Gantt chart or Change Roadmap here as the deliverable of that analytics journey. You could also phase shift this slightly to show a visualization of what the Outcome of that Change was.
  • “Falling Action.” Now that you’ve made your main point, you can use this part to tie up loose ends, resolve other challenges or conflicts besides the main one, describe what happened to the characters after the story, or even use it to tease a sequel. You can also use this part as a “Call to Action” for the viewer if you want them to do something, such as give feedback or share your dashboard with others. 

Now that you have the main foundations of Data Storytelling under your belt, give it a try. The best way to master it is to practice it often. Learn what works best for your data and your audience. A-B test different approaches and get feedback on what worked. Look back over earlier work from yourself and others and list out the things you might have done differently now that you have this new knowledge. Hopefully having a structure like this to start with will give you confidence in choosing and arranging your next visual exercise to maximize its message and persuasiveness. How will you know you’ve succeeded? People will tell you. People know good storytelling when they experience it. Good luck!

Categories
Business Intelligence Data Visualization

3 Powerful Steps to Data Storytelling

In the digital economy, data is mana. It’s the fuel that keeps the tech and marketing sectors churning. But when using data as a sales or education tool, plain old stats and facts just aren’t enough. Massaging data into a compelling story is key to onboarding clients, securing investors, and training employees.

Human brains are wired for stories. As evidence, a Stanford Business School study revealed that 62% of participants remembered stories while only five percent remembered straight statistics. That’s an immense difference, and the results should have every business asking: How can we transform our data into engaging narratives that sell, convince, and teach?

What is Data Storytelling?

Without framing, data can come across as flat, bland, and vulnerable to interpretation. Businesses wanting to burnish their brands in the brains of target audiences must carefully craft their messaging and bolster it with supporting data.

Why is Storytelling So Effective?

Storytelling is how cave people evolved into modern individuals. It’s a linguistic tradition hard coded into our DNA; it’s how civilizations passed down survival skills and traditions. Storytelling remains an integral part of how we process and retain information.

Read more: Data Storytelling: The Essential Skill for the Future of Analytics

What is the Goal of Storytelling?

The goal of data storytelling is to engage audiences. You can highlight insights that will stick, convince, and stimulate the desired action by packaging narratives in digestible and engaging bites of information.

As a presenter, your job is to focus people’s attention on the most salient and engaging points. Think of yourself as the Degas of data — someone who paints beautiful pictures using stats and trends. By framing the mundane in gilded casings, you’re heightening the audience’s emotional response, which leads to better retention of the material.

Three Steps of Effective Data Storytelling

We’ve discussed why data storytelling works. Now let’s dig into the “how” of the matter.

Become Intimate With the Data

Before crafting data stories, familiarize yourself with the information. Don’t manipulate the data to suit your needs. People instinctively pick up on phony or inflated stats — and that diminishes trust. Instead, become intimate with the facts and figures and find the actual statistical trends hidden within. They’re more impactful than jerry-rigged half-truths.

Understand Your Audience

The next step is getting to know your audience. What makes them tick? What do they care about? What’s their worldview? How does your data connect to their goals? The answers to these questions will shape a story that connects with your targets emotionally. Once you tap into their zeitgeists, you can more readily sell the vision.

Remember that one size does not fit all when it comes to data narratives. The tale you tell to a room full of mid-level managers will differ from the one you tell executives.

Choosing the Right Data and Presentation Style

Visuals matter — a lot. They help clarify, connect, compare, and provide context. Effective visualizations include information about the most compelling data as well as highlight the best parts. While it’s almost always better to have professionals design presentations, here are a few DIY pointers:

  • Comparisons: If you want to highlight comparisons, use bar, line, and circular charts.
  • Composition Statistics: Showing data composition statistics is best done with pie charts.
  • Distribution of Data: Line distribution charts work for displaying data distribution points and trends.
  • KISS: When creating charts and graphs, adhere to the adage “keep it simple, silly.” Leave the 3D renderings and drop shadows to game developers. They only mess up business presentation aesthetics and may come across as outdated.
  • Color Consciousness: Data presentations are not the time to express your inner Rainbow Brite! Choose a pleasant color palette and use complementary colors; they’re easier to understand at a glance than a hodge-podge of hues.
  • Language: Use words and phrases that your audience understands. Don’t try to “sound smart.” It never works and can reflect a lack of confidence and communication.
  • Layout: Each slide should have a call to action, a header, and a short narrative summary. People’s attention wanders during presentations. Combat this by keeping things clear and concise!

Crafting effective data narratives that speak to people’s desires and emotions is a skill that takes time to develop. Professionals understand how to mold micro and macro elements into engaging stories. It’s no question that data storytelling is an invaluable tool. And when done correctly, profits follow.

Categories
Business Intelligence Data Analytics Data Visualization

What is a KPI Dashboard?

What is a KPI Dashboard?

Every day your business collects hundreds or even thousands of data points, and it can be overwhelming to wade through all of this information. Key Performance Indicators (KPI) are the different metrics used to access if you’re reaching your business objectives and goals. 

There are numerous KPIs that businesses can use, but the most common are Quantitative, Qualitative, Lagging, and Leading KPIs. 

Quantitative KPIs deal with numerical data such as currency, percentages, and statistics. Qualitative KPIs, on the other hand, takes into account the interactions of your customers. It factors their opinions, experiences, and even feelings towards your business or product. 

Lagging KPIs takes a look at historical data and uses it to predict future outcomes. Most Leading KPIs, though, look at performance for future forecasting. Typically these will be used together to help increase your overall visibility. 

Looking at all of this data separately can be both time-consuming and inefficient in the use of resources. A KPI dashboard can look at all of this data and provide you with key information at a glance. That allows you to monitor goal performance, find ways of improving workflows, and make sure that you’re making the best use of your resources. 

Who Can Benefit From a KPI Dashboard?

Businesses that are already gathering any form of operational or transactional data can benefit from a KPI dashboard. Organizations that need to make adjustments to their workflow or data collection processes would also benefit from a KPI dashboard. They can see information at a glance to know if the business is over or underperforming in regards to trends, quarterly goals, and business strategy. 

Companies that have numerous departments or organizational levels can take advantage of a KPI dashboard. Each business function may have its own individual goals and the dashboard can help paint a clearer picture of how that fits into the organization as a whole. That way you can manage your target strategies and identify which areas of your operations need to be streamlined. 

What Are Some of the Benefits of a KPI Dashboard?

A KPI dashboard can provide you with new insights into how your business is performing. Whether you want a high-level view or need to drill down for more detailed information, you can customize reporting to meet the needs of your business or department. Additionally, the KPI dashboard can also be customized to meet the needs of individual users. That way the data can be tailored to what’s relevant for each person’s role and daily responsibilities. 

Some examples of KPIs that you can put into your dashboard can include:

  • Revenue per customer
  • Project time
  • Churn rates
  • Net profit
  • Revenue growth

Depending on the size of your business, you could be using hundreds of KPIs. Regardless, dashboards will work to filter and highlight the key information. 

Another benefit of a KPI dashboard is that you can scale the data. You can get down to individual performance metrics, departments, or teams so that you can easily access desired information and find ways of improving performance. 

Using a KPI dashboard can also help businesses make decisions about their investments. You can get real-time updates to monitor the ROI and use historical data to forecast profitable future investments.

Why Should I Use a KPI Dashboard for My Business? 

When building a KPI dashboard, you should consider metrics that are relevant to the goals of your business. Examine the various stakeholders in the organization and access who will need to access the data, then choose the KPIs that align with their goals and strategies. 

When selecting individual KPIs, you should focus on actionable metrics. Be specific with your goals and focus on the ones that are of the highest priority. If the business strategy changes, you can always go back and adjust the KPIs to realign with your new approach. At the end of the day, the KPI dashboard that you use should help improve your business. 

As your goals and strategies change, the KPI dashboard should be robust enough to adapt as well. A KPI dashboard that works well for one industry may not work for yours, so it’s important to do your research and find the right components for your business.

Categories
Business Intelligence Data Visualization

The 3 Key Pillars to Better Dashboard Design

How you design your dashboard is crucial when it comes to displaying your data effectively. It’s important to visualize your data in a way that’s clear and easy for viewers to understand. However, with the abundance of data and reports needed to answer queries, it can be difficult to know what to consider in your design process. Let’s dive into the three key elements to implement when improving your dashboard design.

1. Develop a Plan

It’s natural to want to play around with your data and jump right into building dashboards. Nevertheless, when beginning, try not to start creating and adding charts right off the bat. It’s useful to plan ahead and layout the details of your dashboard prior to actually constructing it. This means determining the overarching purpose of your dashboard as well as what information needs to be included. Planning ahead will help to minimize overcrowding and continual adjustments to your design later on. 

What Should Go Where?

Thinking about the user’s experience when viewing a dashboard is essential when it comes to deciding where specific information should go. Here are a few things to think about when determining your initial dashboard design plan.

Placement

There is only one thing to be said about placement: location, location, location. While your dashboard is far from the real estate sector, consider that users will naturally give more attention to the left side of the screen. According to a recent eye-tracking study, users spend 80% of their time viewing the left side of the screen and only 20% viewing the right. 

Specifically, users were found to look to the top left corner of the screen the most, making this section of your dashboard prone to increased amounts of attention. The most utilized graphs and metrics should be placed in this portion of your dashboard, or any additional visualizations you deem significant. 

Don’t Hide Things

Similar to the point above regarding placement, you want to prioritize key information and make sure it’s easily found. You can’t expect much work from your end viewer to dive deeper than the surface data presented. Any additional clicking or scrolling required to find information is unlikely to be discovered by viewers. 

All things considered, an easy way to solidify your plan would be to create a rough draft either on paper or in any design application. This will allow you to play around with your placement and take a deeper dive into how certain elements complement each other.

2. Sometimes Less is More

We’ve all heard the common phrase that sometimes “less is more,” and dashboard design is no exception to this philosophy. You want your dashboard to be clear, concise, and easy to read. Avoid including too many charts and any unnecessary information. While an abundance of charts and graphs might appeal to the data driven enthusiast in you, they might be difficult for other viewers to read and understand. Minimizing the amount of data presented will prevent your audience from feeling overwhelmed due to information overload.

Choosing the Right Data Visualization

Choosing the most effective visualization for your data plays a key role in your dashboard’s simplicity. This is dependent on the type of data you are trying to visualize. Are you working with percentages? Data over a specific period of time? Are there any relationships present that you are trying to convey? 

The many variables that make up your data will affect your ultimate choice in visualization. Be sure to consider characteristics such as time, dates, hierarchies, and so on. 

3. Keep the End Viewer in Mind

Your audience is just as critical to your dashboard’s design as the information being presented. It’s important to always keep the end viewer in mind and understand how they are actually using the presented information.

When determining the characteristics of your end viewer, ask yourself questions such as:

  • Who will be viewing this dashboard on a daily basis?
  • How often do my viewers work with the type of data being presented? 
  • How will my audience be viewing this dashboard? Will viewers be sharing it as a pdf?

The answers to these questions will help you determine how much descriptive information to include alongside your visualizations.

Overall, there are numerous elements to consider when it comes to developing your business dashboards. It’s vital to always keep your audience in mind and plan ahead. Consider these key tips next time you’re building a new dashboard for improved design.   

Categories
Big Data Data Preparation Data Visualization

3 Useful Excel Tricks You Wish You Knew Yesterday

Microsoft Excel has become an essential staple for workplace professionals across every industry, especially when quickly working with data and performing basic analyses. With hundreds of functions, it can be overwhelming to try to learn them all as well as know which are most effective. But if used correctly, these functions can help save you an immense amount of time and headache. Let’s explore a few classic Excel tricks every analyst should have in their toolbox.

1. Heatmap

It’s easy to get lost in the hundreds of rows and columns that make up most spreadsheets. You might be left asking yourself, what do all of these numbers mean? This is where data visualizations are key in helping you understand your data and generate insights quickly. 

One effective way to do this is with the use of color and Excel’s heatmap function. To put it simply, heat maps are a visual representation of your data through the use of color. These charts are perfect for comprehensive overviews of your data as well as additional analysis.

This trick can be broken down into three simple steps:

  1. Select the cells and values you want to include. 
  2. Under the Home tab, click on Conditional Formatting
  3. Select Color Scales from the drop-down menu and choose your desired color scale selection.

Following these steps, you can now see your data highlighted in a gradient-based on its value. This can visually assist, for example, in identifying critical dips in sales or inventory by highlighting those cells as red. Overall, heat maps are extremely versatile and can be used to understand data intuitively. They also make for a great visual stimulus in any dashboard or report!

2. Remove Duplicates

The last thing you want in your data is duplicate entries or values. This poses an issue of inaccuracy and other inherent risks in your analysis. Though, removing these duplicates is quite simple when using Excel, here are the steps to follow for one method.

To begin, we need to first identify if there are any duplicates present in your spreadsheet. We can do this by highlighting any duplicates through Excel’s Conditional Formatting function. 

  1. Under the Home tab, click on Conditional Formatting.
  2. Select Highlight Cells Rules from the drop-down menu, then select Duplicate Values.
  3. Determine your formatting preferences and click OK.

Any duplicates present in your data will be highlighted based on the color preferences you determined earlier. Now that you’ve detected the duplicates, you can easily remove them by going to the Data tab and clicking Remove Duplicates. Excel will then tell you how many duplicates were detected and the total removed from your sheet. Duplicate free in only a few simple clicks! This trick can help you minimize discrepancies as well as save time trying to manually detect and delete duplicate values.

3. Filling All Empty Cells 

Chances are your dataset contains a few empty cells, this could be due to incomplete data or any number of reasons. In order to avoid any issues when it comes to your analysis or when creating models, it’s important to fill these cells ahead of time.

Follow these steps to identify and fill all empty cells at once:

  1. Under the Home tab, click Find & Select.
  2. Select Go To Special from the drop-down menu and select Blanks from the provided menu options.
  3. Fill an empty cell with your desired value or text (e.g. N/A) and press CTRL + ENTER.

With this function, all of your empty cells can be identified and filled in a matter of seconds. This trick will help you save time ciphering through columns trying to manually detect and fill empty cells. Additionally, this can be especially helpful when working with large data sets used for creating models.

Back to blog homepage

Categories
Data Analytics Data Visualization

4 Reasons to Utilize Data Visualization Software

The role that data analytics plays in modern business is becoming increasingly appreciated. According to one report, the per-dollar-spent ROI gained from using analytics & increased from $10.66 in 2011 to $13.01 in 2014. Working with analytics is one thing, but translating data-driven insights into useful work products is quite another. That’s where data visualization enters the picture. Data visualization is an opportunity to go beyond dumping data into an Excel spreadsheet. With the right approach, data visualizations can improve a company’s efficiency and effectiveness in the following ways.

Shorter and Better Meetings

At many organizations, analytics need to be converted into work products that are then presented to stakeholders at meetings. How you choose to go about presenting the insights you’ve gained can influence the meetings you have. Research from the American Management Association has shown that data visualizations were able to:

  • Shorten meeting times by 24%
  • Provide 43% greater effectiveness in persuading audiences
  • Bring about 21% more consensus in decision-making
  • Improve problem-solving by 19%

Simply put, coming into a meeting with effective data visualizations makes a meeting faster and more useful. Bear in mind that modern data visualization techniques can yield a lot more than just a few pie, bar and line charts. Today’s data visualization techniques include producing items like:

  • Interactive dashboards
  • Real-time updates
  • Geographic data
  • 3-D maps
  • Cloud and bubble charts
  • Tree maps

Visual Learning

Most human beings cannot listen to or read large amounts of data and readily make sense of what it really means. Human beings tend to benefit from having a sense of how things relate over time and through space, and visualization examples help. In visualization examples, an alluvial diagram of events can help people understand how one thing flows from one place to a new one.

For some sense of how visualization examples can help understanding, consider this diagram of asylum seeking in Europe. Hearing that certain groups are more likely to have their applications accepted based on their origin and destination is one thing. Conversely, being able to study a diagram that shows the flow of people and their acceptance and rejection statuses makes it easier to process the idea.

There are four core data visualization tools that can be used to represent insights. These are:

  • Color
  • Shape
  • Visual movement
  • Spatial relationships

Just being able to differentiate to color-coded data points may go a long way to increase your understanding of the meaning of a piece of research. A company’s data team might visualize questions about new and established customers, for example, by coloring new users with red dots and old users with blue dots. This can make it easier to follow along as you see how changes in the customer base have shifted over time. Compare that to trying to fish out data from a spreadsheet.

Long-Term Engagement

Particularly in the era where data visualization tools like dashboards can be made available to everyone who has a phone, tablet or laptop, there’s a lot to be said for the engagement value of data visualizations. Let’s say a CFO who was presented with a report at a meeting wants to refer back to materials from the session. Rather than having to sift through papers or ask someone to email them a particular slide, they can simply pull up the company’s data visualization tools and check the presentation there.

More importantly, increased interactivity can keep decision-makers engaged with data. Being able to click on items and see how different factors shift can improve engagement significantly. Especially when working with parties that aren’t 100% sold on your ideas, it can be helpful for them to scan and interact with data over several iterations.

People also enjoy interacting with data. Switching back and forth using the data visualization tools between an operations current-year report and one from last year, for example, can foster engagement and interest.

Promoting Culture Change

Becoming a data-centric organization requires bringing along decision-makers, employees, contractors, customers and other stakeholders. You want to onboard as many of these parties as possible as your company starts valuing data as a part of its decision-making process. Whenever possible, you also don’t want to leave people behind.

Data visualizations can help folks get onboard with a culture change that’s moving toward data and analytics. Improvements in engagement, learning and efficiency can help them feel why the culture change has to happen and how it benefits them.

Stakeholders will eventually become more proficient as they settle into patterns of using visualizations. They will come to understand and apply statistical concepts such as:

  • Regression to the mean
  • Outliers
  • Hypothesis testing
  • Statistical confidence and uncertainty

They’ll also begin to appreciate why certain data visualization techniques were employed.

Over time, analytics insights can become a product that stakeholders start to demand rather than dread seeing. People will whip out their phones and tablets to check up on the state of the company in real-time via dashboards. Instead of feeling like the culture change has been imposed upon them, they will start to see it as just something they can’t do without.

Read More Here

Polk County Schools Case Study in Data Analytics

We’ll send it to your inbox immediately!

Polk County Case Study for Data Analytics Inzata Platform in School Districts

Get Your Guide

We’ll send it to your inbox immediately!

Guide to Cleaning Data with Excel & Google Sheets Book Cover by Inzata COO Christopher Rafter