Categories
Business Intelligence Data Analytics

What is the Difference Between Business Intelligence, Data Warehousing, and Data Analytics?

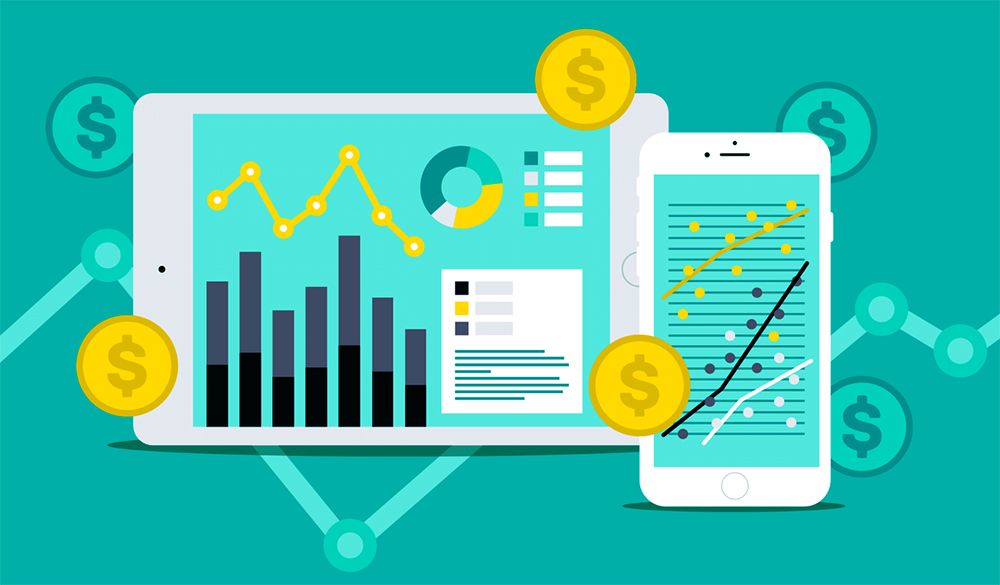
When listening to discussions of many of the core concepts of the big data world, it often can feel like being caught in a hurricane of technobabble and buzzwords. Three of the most relevant concepts to understand, though, are data warehousing, data analysis, and business intelligence (BI).

Individually, each of these concepts engenders one-third of an overall process. When that process comes together, a company can more efficiently collect data, analyze it and turn it into actionable information for decision-makers at all levels of an operation.

The What

Data warehousing is the most straightforward of the three concepts to understand. As the term suggests, it’s the process of taking collected data in a company and storing it in places where it can be kept secure and accessible. This means having access to either on-site database servers or off-site cloud storage platforms.

Data analysis is the process of scanning through the available data an organization has in order to produce insights. Many people misuse this concept interchangeably with BI. The distinction is that data analysis tools help professionals handle the tasks of:

  • Acquiring data from sources
  • Prepping data for analysis
  • Confirming data integrity
  • Identifying statistically grounded methods for gaining insights
  • Using computing resources to rapidly cull massive amounts of data
  • Iterating through permutations of statistical models to generate insights
  • Verifying that any generated insights are statistically valid

Business intelligence is about taking the raw insights gained using those data analysis tools and turning them into actionable information. BI platforms are designed to provide visualizations and data to stakeholders. For example, a U.S. retailer might offer its buyers in China real-time data streams of insights derived from scanning millions of influencers’ feeds on Twitter, Instagram, Facebook and other social media platforms. This allows the buyers to look at the insights and quickly make decisions about what’s likely to sell well in the upcoming fashion season.

The How

All of this work calls for the support of folks who have experience in working with computing resources at large scales. There’s a lot more going on here than simply putting entries into a spreadsheet. The industry employs plenty of data scientists, computer programmers and IT professionals. Likewise, individuals with business backgrounds in consulting are often in high demand.

From end to end, a company has to build its training and hiring practices around fostering a culture that values big data and insights. Building such a culture often presents its own set of challenges, as many people prefer to make choices based on tastes, gut reactions and “eye tests.”

If you want an insight into how this process unfolds, look no further than the world of professional baseball. Few sports are now as driven by analytics as baseball. Starting at the turn of the century, small clubs that were strapped for cash began hunting for market inefficiencies. Two decades later, everyone in the business is using data analytics tools to make decisions. In 2019, the Houston Astros announced they were cutting their scouting department significantly while adding more people in analytics.

The Why

One of the classic examples of how statistically driven insights can defy expectations is the so-called Monty Hall problem. The original version of the show “Let’s Make a Deal” featured a game where a contestant had to choose one of three doors to win a prize like a new car. Behind one door was something no one wanted, such as a goat. Another door hid the car, and a third one hid a lesser prize.

After the contestant picked a door, the host would reveal what was behind one of the other doors. For the sake of dramatic tension, the host never showed the goat or the car in the first reveal. The host then would ask, “Do you want to change your pick?”

According to volumes of computer simulations and PhD-level stats papers, the answer should always be “yes.” By switching, the contestant improves their chance of winning from 1/3 to 2/3.

If that feels wrong to you, don’t feel bad. The answer is not intuitive. Most people assume the contestant has somewhere between a 1/3 and 1/2 chance when switching. Thousands of respected mathematicians even tried to refute the solution.

Lots of business decisions are basically the Monty Hall problem scaled into the thousands, millions or even billions. There are plenty of doors to pick from, and the goats far outnumber the cars. Also, you’re competing against numerous other contestants simultaneously.

Unless you need to pay a dowry, you probably don’t want that many goats. How do you improve your chances of finding the winning prize? You embrace the value of data warehousing, data analysis and business intelligence.

Categories
Data Monetization Insurance

Monetizing Your Data in the Insurance Industry

“One way to future-proof a business in the insurance sector is to lean on data monetization software.”

As the insurance industry changes alongside a number of social and technological trends, many companies are looking for ways to improve their bottom lines using data analytics tools. One way to future-proof a business in the insurance sector is to lean on data monetization software. You may be wondering, though, what exactly data monetization is and how you can put it to work.

The What of Monetizing Data

Data analysis can be performed using a number of resources that most insurance providers already have access to. The industry is demanding in terms of the amount of data that is taken in from customers themselves and from incident reports. This offers a lot of opportunities to go into a data lake and derive insights that may help a firm operate more efficiently, reduce risks and properly priced products. You may be interested in conducting:

  • Fraud detection
  • Loss prevention
  • Predictive modeling of macro-scale risks
  • Analysis of customer relationships

One major advantage that most insurers have over companies in other sectors is they tend to own huge repositories of historical data. When working with analytics, it’s impossible to over-emphasize just how much value comes from feeding more information into any data monetization software system.

The Why

If your company is curious about the potential impact of new safety features on automobiles, for example, you can make comparisons to historical precedents. This can include looking at moments like the advent of seat belts and airbags, to get a sense of what the risk profile of your average customer will look like in 5, 10 or 20 years. While this sort of modeling isn’t considered purely predictive, it provides a starting point for understanding changes that are hard to plan for.

Fraud detection is also a major opportunity for monetizing data. In the modern business environment, many people engaged in fraud are working together either directly or sharing information across the internet. This means that new kinds of fraud can appear seemingly out of nowhere. Likewise, individuals engaged in fraud may move around. By looking for patterns in how they purchase insurance and file claims, it’s possible to identify both buying and filing behaviors as they’re just appearing.

The How

Acquiring the staff and building out the infrastructure required to perform meaningful data analysis requires a significant shift in a company’s attitude toward computing. Data science places an emphasis on testing various hypotheses, and that means you’ll need team members who have strong backgrounds in statistics in order to assess the relevance of output from your data analytics tools. This goes beyond the basic actuarial work that’s done in the insurance world and extends into other disciplines, including computer programming, economics, pattern recognition, social sciences and even psychology.

All this work is underpinned by significant amounts of computing resources. In particular, companies need a lot of data storage capacity to provide robust enough databases for analysis work. This entails installing servers, setting up redundancies and providing reliable networks for both machines and users to communicate across. In some cases, a high-speed network may call for completely re-cabling buildings to ensure the infrastructure is robust enough.

Culture Change

Establishing a culture that values data and analysis is also critical, and it demands more than just bringing in stats geeks, IT people and computer programmers. From the bottom to the very top of your organization, stakeholders need to be on-boarded with the culture change. This includes training sessions where decision-makers are taught about data dashboards and what their contents actually allow them to do.

Likewise, training needs to include education about the power and limitations of data. The insurance industry has many privacy issues that have to be broached. There also needs to be an understanding that excessive reliance on computer-driven answers can create its own set of problems.

One downside to this approach is that some people are going to resist change. New assignments and severance packages need to be available to ensure that folks who can’t follow the company into this new era aren’t left in positions where they can impede progress. Hiring processes should also be altered to ensure that new employees show up ready to be part of a data-centric business culture.

The culture change toward data analysis is a long one that calls for commitment. It takes time to bring in skilled professionals to set up systems and make choices about what processes need to be used. Similarly, stakeholders need to be patient in order to allow the benefits of monetization of data to begin to flow into the company. As the culture shifts and processes are refined, though, you’ll begin to see a discernible uptick in profits. 

Categories
Data Modeling Data Preparation

The Marketing Analytics Tool You Need in 2019

The Purpose of Marketing Analytics Tools

The field of marketing is a very large, intense, and sometimes complicated web of customer data from a wide variety of sources. Not only do you have the umbrella categories of marketing tools such as CRMs, paid ad managers, social media, website analytics, etc., you also have the numerous tools that fall under each of those categories, leaving you with upwards of 10 data sources to attempt to collectively analyze without spending a week’s (maybe even a month’s) worth of time creating unattractive an unreliable pie charts on Excel that need to be updated everyday. Marketing analytics can be difficult to conquer…unless you have the right knowledge and marketing analytics tool.

Isn’t my CRM the Marketing Analytics Tool I Need?

Thankfully, CRMs such as HubSpot and SalesForce are very talented at keeping their data organized properly, and HubSpot has decent reporting tools. The problem is that these marketing analytics tools report only their data. Yes, some CRM’s, such as HubSpot, let you integrate your Facebook ads and Google analytics, but they are not included in their reporting tools when it comes to comparing marketing emails to social media ad performance to website website traffic… see what I mean yet?

Advertising Data

Paid ads managers and social media, such as Google, Facebook, LinkedIn, Twitter, YouTube, etc., each have their own reporting and marketing analytics tools, and while some of them are decently detailed, some of them also – for lack of a better phrase – totally suck! Not only that, but you’re limited to only analyzing their data. So, what if you want to know if your YouTube video views spiked when you ran your new Twitter campaign? What if you want to know if your LinkedIn profile engagement decreased because of a low quality Facebook campaign? Sure, go ahead and bounce around from website to website… go ahead and waste an immense amount of time.

Website Data…Yikes!

Your company’s website data is the kicker, and what will ultimately prove my point. Not only are you interested in your website visits, specific page visits, traffic sources, and about 35 other things, but you’re also A/B testing your landing pages, wondering why your pricing page has a 80% drop off rate, and why half of your visits are from people who live in a country you’ve never heard of. My point is, every business has a wide variety of numerous questions about their website traffic and conversions, or lack of. Is it being affected by your email campaigns? Or by your Facebook and LinkedIn ads? Or by your YouTube videos? Or by your unknowingly low quality landing pages? There are so many questions, and even more data sources. Utilizing the right marketing analytics tool along with a pinch of automation is the key to answering your vast list of questions about your website traffic behavior.

How Do I Combine All of This Data?!

The solution? An end-to-end marketing analytics tool to collect your data from each and every source, in real time, modeling it into a single dashboard that can virtually answer any question you have about your marketing and customer data. Given the opportunity to pull any single piece of data and compare to another single piece of data, your questions and answers about what you are doing right – and more importantly, what you are doing wrong – are endless. Make the choice to stop wasting your time and money on bad marketing decisions and analyze your data with immense precision and speed, using Inzata. Compare Hubspot to Facebook to YouTube to Google to MailChimp to Salesforce to Twitter to LinkedIn to any source you can think of, in real time, with ease. Skyrocket your marketing team’s performance with Inzata. 

Categories
Data Modeling Data Preparation

Data Lake? More Like Data Swamp!

Building a collection of data sources that a business or an organization has into a data lake that everyone can access is an idea that inspires a lot of interest. The idea is to make the data lake into a resource that will drive innovation and insights by allowing clever team members to test ideas across many sources and variables. Unfortunately, a lack of good data curation techniques can lead that lake to become a data swamp in no time at all.

An Example

Let’s say you want to take a database that contains information about all the employees at your company. There are two data sources, with one that includes an employee’s name, salary, birthday and current address. Perhaps the second source includes information about their name, current city of residence, listed hobbies from their application and salary.

You want to bring these collections of information together. That’s the data ingestion process. Data_Lake_721_420_80_s_c1

There will be transformation needs, as you’ll have to breakdown information like the address into its constituent pieces, such as street, city, state and ZIP code. Similarly, the street address itself may be one or two lines long, depending on things like whether there’s an apartment number or a separate P.O. box. There may also be more advanced issues, such as differences in formatting across countries.

Schema issues also present problems. For example, let’s say you have an entry in your first source for “John Jones” and another for “John J. Jones” or something similar. How do you decide what constitutes a match? More importantly, what criteria can be used to ensure actual matches are obtained through the kinds of automated processes that are common during data ingestion?

In the best-case scenario, good data curation practices are in place from the start. Some sort of unique identifier is employed across all your data tables that matches people based on, for example, employee ID numbers that are never reused. In the worst-case scenario, you simply have a bunch of mush that’s going to have to be stabbed at in the dark.

The Role of Human Curation

Even if your organization employs best practices, such as unique IDs for entries, date stamps and preservable identifiers across transforms, there are going to be curation needs in virtually every data set. Perhaps you get super lucky and all the data lines up perfectly based on those ID tags, too. Many other things can go wrong.

For example, what happens if there’s a scrubbed or foreign character in an entry? For example, HTML entities are often transformed by security protocols prior to database insertion to prevent SQL injection attacks.

Data sources can also induce problems. Perhaps you’ve been importing information from a CSV file, and you don’t notice one or two entries that throw the alignment off by one or two columns. Worse, instead of getting a runtime error from your code or your analytics package, it all appears to be good. Without a person scanning through the data, you won’t notice a flaw until someone pulls one of the broken entries. In the absolutely worst scenario, critical computational data ends up being passed along and ends up producing a flawed work product.

Providing Access

Okay, you’ve gotten all that business straightened out. Curation superstar that you are, everything aligns beautifully, automated processes flag issues and humans are double-checking everything. Now you have to put usable information into your employees’ hands.

First, you need to know the technical limits of everyone you employ. If someone can’t code an SQL entry, you need to have data in additional formats, such as spreadsheets, that will allow them to load it into their own analytics packages. Will you walk back those transforms in the output process? If so, how do you confirm they will be accurate renderings of the original input?

Likewise, the data needs to be highly browseable. This means ensuring that servers are accessible, and they also need to contain folders with structures and names that make sense. For example, the top level folders in a system may place an emphasis on generalizing their contents, such as naming them “employees” and “customers” for easier reading.

Data curation is a larger cultural choice for an organization. By placing an emphasis on structure the whole way from ingestion to deployment, you can ensure that everyone has access and quickly begin deriving insights from your data lake.

Categories
Data Analytics

Retail Analytics: Boost Your Business in One Day

Few industries are as well-positioned as retail to use data-driven systems to improve their bottom lines. Retail analysis is flush with sources of data, including information that can be derived from sales, inventory, traffic and marketing. Turning all this information into something useful, however, requires an understanding of where retail data systems fit into the bigger picture. Let’s take a look at the trend and how data analytics software may be used to boost your business.

How is it Affecting the Retail Industry?

As of 2019, omnichannel marketing and sales have become key features of how many retailers and customers interact. Even the simplest forms of this approach have changed what items are put into inventory, which customers are met with what appeals, how prices are chosen and how stores themselves are designed.

For example, let’s look at loss prevention systems that are used by many brick-and-mortar retailers. Using retail analysis methods, we can quickly spot which departments suffer the greatest losses. Items that are commonly stolen can be moved to spots where sales associates can see them. Closed areas of stores that allow for bad behavior can be opened up to observation. Patterns that might not be obvious to the average person can be discovered by comparing data across multiple stores.

Why Should Retailers Invest in Data Analysis?

Supply chains are being tightened up like never before. In the world of clothing sales, for example, you want to keep inventory purchases as close to trend spotting as possible. Retail data systems can dig deep into information gleaned from social media to empower buyers on the other side of the planet to make decisions about items to put in stores and on websites. The timing of trend data pulled from customer analysis will increase the chances that a trend will arrive in stores right before it’s ready to take off with the general public.

Personalization also offers many opportunities. Insights can be derived from mobile apps, website purchases, in-store sensors and post-of-sale units. Marketing appeals can then be tailored to the specific tastes and desires of the customer, such as offering coupon codes via text when the mobile app notices they’re within a certain driving range of a physical store.

All of this is data intensive. Customer analytics calls for a backend of systems that can store data securely and make it readily available to decision-makers in a timely manner.

Analyzing Customer Behavior

Good data science people approach customer analysis with a highly experimental attitude. Let’s say you want to determine the optimal layout for your store’s website. A/B testing methods can be utilized to discover how to maximize ROI. You simply serve multiple version of the website, and then you can use data analytics software to compare which versions kept folks on the site longest, drove sales and encouraged return engagement. Customer analytics can even be utilized to establish whether some customers should be pursued more aggressively with offers, sales and other incentives.

Using Predictive Analytics

Figuring out where to put money before the next sales season hits will be one of the biggest goals of many retail analysis efforts in 2019. In-store Wi-Fi offered for free can include opt-ins that allow data gathering and mining to be performed. These can then be used to determine which customers should be encouraged with loyalty programs, points offers and more. Metadata can even be employed to establish what the relationships are among different customers, allowing you to see how friends circles and families influence members.

Ultimately, you want to get to the point that predictive systems provide prescriptions. In addition to getting ahead of trends, decisions can be made about how many items to put on shelves, what times of day customer support is most needed and where to place salespeople in stores.

Processes will be increasingly tailored around the customer experience and ROI. Assortment analytics can be used to make recommendations regarding products that are frequently purchased together. This can be used, for example, to issue coupons at checkout that will encourage customers to come back soon. Similarly, website and app versions of stores can point customers toward product recommendations they’ll actually want.

Deriving these sorts of insights is not a light undertaking. Data needs to be accumulated in sufficient quantities to ensure that predictions actually track closely with results. A data-driven attitude has to be fostered throughout a business, and an eye always has to be kept on quality control. In time, though, a company can form a robust base to work from and to deliver value to both customers and internal stakeholders.

Categories
Data Analytics Data Quality Data Science Careers

I’m Outta Here: The Top Frustrations of a BI Engineer

The statements below first appeared in the r/BusinessIntelligence subreddit.

I have been working as a BI Developer/Consultant for the past 5 years after graduating from University. Many people are thinking about a career in this field. I thought I would offer my perspective of the problems I have faced and what led to my decision to move away from BI. Would love to hear any opinions/advice from others.

The first point I want to raise is that things have changed A LOT in BI/Data jobs over the past 5 years and not for the better. The job does not carry the same level of respect or ‘perceived’ value in an organization. Before you all murder me, let me explain. Data has more value than ever, I agree. However, the people who extract, clean, combine and deliver this data have much lower value. I am not sure why this has developed.


Advantages of BI/Data Careers

Job title of BI sounds fancy to most people. Salary ramp-up to mid level ($80k) on par or better than other IT/Business fields. (BI does cap out much earlier than other fields).

Easy to get into a low workload job as a Excel/PowerBI/Tableau data cruncher with a mid-level salary. Progress after that is very hard unless you make shifts to other areas.

Disadvantages of BI/Data Careers

Work that nobody wants to do gets dumped into the BI department. Its role is less well defined and it’s easy to sneak the mistakes of others into “the data department.” There’s no systematic way of managing the quality of what arrives in. Once we’ve taken custody of it and a few days have passed, it’s our problem. As if somehow 7,000 emails got turned into NULL in the 2 days since you sent me your file.

I once worked with a client that ran a yearly survey to gather data. They produced a report of top 100 companies and industry trends. Nobody in the client’s company wanted to sift through over 10,000 survey responses. Nobody wanted to clean data, extract insights from survey responses. So they just sent it.

This entire workload fell to us. the external consulting company, even with our $150-per-hour bill rate. It took us weeks of work and the company paid out quite a bit. Of course, remember I did not see $150-per-hour for this work, I just received my salary, which was in the $60k range. So who benefited and who overpaid?

Another example, this time from a large enterprise. Daily data loads extract data from [HR, finance, payroll, etc.] systems. New employees are sometimes set up with different/wrong values in different systems. This causes major issues in reporting/BI tools. Senior Management was quick to blame BI. They didn’t consider the inefficient processes, or mistakes at the operational level that led to this. The HR/Finance analysts don’t care about these issues. It got so bad, eventually setting up new employees in the HR system fell to BI analysts. They main reason was that they cared the most about the data.

The end users look at the data once a month if at all. The weekly emailed static reports often go unread. Instead the end users revert back to the prior solution where data is sourced by BI analysts manually. Guess what the reason was? End users find it boring to have to use cubes to browse data or PowerBI/Tableau to manipulate data. They prefer to file a request with the BI team and let them do that work, or have analysts send them a weekly email. Or simply sit in a meeting where someone else tells them what’s going on.

Salary cap to what BI developers can earn. I find that as a BI developer, my salary peaks at around 80% of what other types of developers earn at upper levels. Market rate for me is 90-100K (USD) in house and 100-120K (USD) consulting.

This is made worse by the number of senior SQL server/DBA/BI consultants (+20 experience) in the market. You don’t need more than 3/4 years experience with a BI toolset to get the job done properly. Yet I have been on many projects where clients have asked for someone with 12+ years experience. They’re later surprised when they learn someone with 4 years experience did the projects.

Job tied to a tool/industry. I was never sure why this matters so much. The ability to learn a new tool to get the job done is under-appreciated. I have worked in finance/retail/media and government BI. But I have been told I am not skilled enough to work in x industry or with y tool that varies slightly. Add to this jobs where I see people with masters or PhD level education doing BI Analyst work. People are on-average under-utilized, in my opinion.

BI testing. The most boring, manual, but most necessary part of any BI project.

Testing SQL business logic is painful because of the lack of automated testing solutions used across companies .

Testing with popular tools (PowerBI, Tableau) is nearly always manual . (Good luck testing complex finance dashboards with complex DAX business logic.)

Source system testing is non-existent. (What happens if you change the time zone in a source finance application. Does all the data for the user we extract change at a DB level as well?)

ETL testing (good luck testing 100+ SSIS packages).

Data Warehouse testing: all too often, complex business logic is piled on top of existing logic due to source system upgrades. cube/dashboard testing. No automated solutions exist. Mainly manual.

It’s rare to find business users who will agree to do testing properly. I have seen business users resign from jobs rather than sit and test large amounts of data manually.

While a career in BI is still very attractive to knowledge workers, I wanted to share the pitfalls. I hope my experience helps others. The space still has some maturing to do. If you get with the right organization, it can still be a great career. If they let you use the right data analysis tools, it can still be a win. The key is being able to quickly understand the environment and make quick decisions.

As an employee, you should be watchful for this, but you do have some choices . As a consultant – as I was/am – you’ll often get dragged into some of the worst environments to help fix things.

Expect that.

One can easily find themselves stuck cleaning data in Google Sheets for most of each day. It’s important to recognize the signs and signals of a good BI vs. a bad BI environment. My advice: look for places where business users are actively involved in BI projects. Companies that invest in their data, and in advanced AI tools. Places where they actually care about the outcome and respect the work you do. Because it’s important. You’re important.

Good luck out there.

The statements above first appeared in the r/BusinessIntelligence subreddit.


Categories
Data Analytics

Data Analytics in the Real Estate Industry: Defeating Your Competition

The arrival of real estate analytics has significantly changed how buyers, sellers and agents treat the market. The industry was once heavily dominated by hearsay and generic impressions, but many concerns that homebuyers have can now be addressed with hard facts backed by data analytics. The emergence of artificial intelligence also holds out the promise of even greater insights. Let’s take a look at how this revolution is unfolding.


What is Real Estate Analytics?

As it pertains to this industry, real estate data analytics is the practice of using computing resources to assemble large amounts of information about properties and neighborhoods. This can yield insights that no human could ever obtain due to the sheer amount of time it would take to digest all the information. Big data systems can be set up to collect information from recent sales, the MLS system, government reports and market forecasts. 

This allows us to make projections regarding a variety of things of interest. For example, let’s say property investors want to know what the business future of a district in a city is. Utilizing artificial intelligence, we can develop methods for compiling available information about things like demographic trends, buying and selling habits, micro- and macro-economic developments and even individual properties and their owners. This can even be taken a step further to model the entire region over several years, providing probabilistic views of what the district will be like at specific points in the future. 

——————-

How Do We Use This Information?

Let’s say a residential property flipper wants to figure out what their exit point on a location should be. Looking at real estate analysis trends like population growth and income in a region, we can project when the market is likely to max out returns. It’s even possible to model the behavior of other flippers on the market, allowing us to guess how long pressure from their presence in the market may actually allow sales to continue to go long. By assembling these projections grounded in data analytics into reports, we can then ensure that folks directly involved in buying and selling will have a better idea of what we want to buy and when we want to sell it. It can even allow us to guess which parts of a town might be ready to heat up, permitting us to buy before the big wave hits. 

If you want to know when it might be time to move in on a target property, it’ll be there in the data. You can set standards for what counts as a buy and wait for the market to come to you. Let’s say you have a strike price for purchasing a location that has been on the market for 300 days. If there’s no evidence of activity regarding the property, your analytics package can flag it, inform someone and verify that followup is done.

——————- 

Who is Involved in This?

Becoming a more data-centric operation means undertaking a massive cultural shift. Folks with math and programming backgrounds are essential to the task. Due to market-wide demand for such talent, there’s a good chance that, unless you run a massive operation, you won’t be doing this in-house. 

At the same time, staff members have to be on-boarded with the cultural change. In fact, you may need to identify resistant team members who will have to be moved to other roles or retired. Over time, though, the development of a data-centric business model will put you ahead of the game, whether you’re working as a buyer, seller, or facilitator.

Categories
Artificial Intelligence Data Analytics Insurance

How to Accelerate AI in Insurance Data Analytics

Mastering techniques around Insurance data analytics, knowing what data to get, and how to analyze it, greatly streamlines many of the most expensive insurance business processes.

“The United States is the world’s largest single-country insurance market. It writes more than $1 trillion in net insurance premiums every year. In emerging markets, China continues to be the growth engine.

All together, the global insurance market writes over $5 trillion in net insurance premiums per year.”  

Insurance Journal

Despite its size and global reach, the insurance business model has always been about two things.

  1. Maximizing the premiums received
  2. Minimizing the risk of your portfolio

Beneath these two top goals are a myriad of activities every insurance company has to master, including:

  • Reducing risk
  • Reducing fraud
  • Keeping customers happy with great service
  • Finding new customers with favorable risk profiles

Insurance fraud alone costs the insurance industry more than $80 billion per year. In an effort to overcome fraud, waste, and abuse, many companies are turning to insurance data analytics.

The staggering level of criminality costs us all, adding $400 to $700 a year to premiums we pay for our homes, cars, and healthcare, the feds say. There are simply not enough investigators to put a significant dent in the criminality, so the industry is turning to the machines.

Reducing Risk & Improving Customer Service

The insurance industry definitely has plenty of data. A single claim could have dozens of demographic or firmographic data points to analyze and interpret. A single policy could have dozens of individual attributes depending on what is being insured. Data enrichment, which has become more and more popular, can increase these data points into the thousands.


However, as insurance companies succeed and grow, datasets become increasingly large and complex. Often these are locked inside massive policy and claims management systems which do a great job of storing and maintaining the data. These do a great job for looking up individual policy records and claims, and of course, handle billing and renewals quite well.

When multiplied across an organization’s entire book of business, data sets become so large that legacy, on-premises systems are unable to keep pace with data volume, variety and velocity.

But what else could insurance companies be doing with All. That. Data?

We know when data is looked at in aggregate, surprising and valuable insights begin to show themselves.

By contrast, cloud data warehouses working in concert with Data Analytics Software make it possible to ingest, integrate, and analyze limitless amounts of data, freeing up resources to automate these important business processes:

Mastering these techniques around insurance data analytics, knowing what data to get, and how to analyze it, greatly streamlines many of the most expensive insurance business processes.

Customer Quoting, Risk and Pricing Analysis: Life insurance companies harness analytics to provide customers an expedited application and quoting workflow.

Writing Life insurance used to require multi-step risk scoring and an in-person health screening for the customer with a physician. Now it’s done almost instantaneously through the secure analysis of an applicant’s digital health records.

Fraud Detection: Property insurers use data analytics to detect and mitigate fraudulent claims. Predict fraud events from available data before it happens with a predictive analytics platform. Using Machine learning powered historical fraudulent claim data to model your risk in real-time. Look for highly predictive factors that correlate to. In this scenario, past performance is indicative of future results.

Detecting High-Risk claimants: Other algorithms can proactively monitor your portfolio and identify high risk claimants on a recurring basis, over time. After all, most claimant risk is only assessed once – when the policy is first written. However we know, financial circumstances change, properties age, vehicles require repair. Pulling together all obtainable data – policyholder financial and employment status, vehicle repair log, etc. tells companies what’s happening right now and what is likely to will happen next. This reduces manual effort and increases the effectiveness of fraud detection processes.

In about one third of cases, claims can be approved and paid out essentially instantly on approval by the company’s algorithms, he says. Even if a human is involved, it’s radically quicker. It becomes just a quick check to confirm the algorithm’s recommendation, instead of a deep analysis.

Source: Fast Company 

Provider Abuse Prevention:  Medicare and Medicaid make up approximately 37 percent of all healthcare spending in the United States. (according to the Centers for Medicare & Medicaid Services.) This adds up to over $1 trillion of government-subsidized hospital, physician and clinical care, drugs, and lab tests.

At these levels, the potential for waste and sometimes abusive billing by providers and health systems is always present. Program administrators and companies contracted by Medicare and Medicaid increasingly rely on insurance data analytics to combat this. This lets them identify patterns and outliers to thwart unethical billing.

Real-time Lead Scoring: New customers are the lifeblood of insurance growth. And never before have consumers and business customers had so many options and choices for insurance.

Predictive lead scoring sifts through inbound channels and optimizes leads by value and priority. Insurance Lead Scoring tools help select the best prospects with the most favorable risk profiles. Predictive lead scoring also tells insurers and brokers the best ways and times to contact prospects.

Behavioral analysis can predict whether a prospect is just shopping around or truly ready to buy. It also identifies the best method of contact for those prospects based on demographic profiling. Some prospects will appreciate a prompt phone call. Some prefer to come to a branch office. A fast growing group prefers typing over talking and responds better to a digital exchange (text messages, web and mobile apps.) Meeting the needs of these diverse audiences is the key to acquiring the best new prospects. This type of advanced profiling lets insurers predict the best methods and timing for prospect communications, and increases close and policy writing rates.


How Big Data Analytics Software in a Cloud Data Warehouse Accelerates Insurance Analytics

Unlike on-premises systems that don’t easily scale, a complete analytics platform featuring a cloud data warehouse, such as Inzata data analytics software, enables organizations to keep pace with the growing demand for insurance data by delivering:

Rapid time-to-value: Realize the power of real-time analytics to supercharge your business agility and responsiveness. Answer complex questions in seconds; ingest and enrich diverse data sources at cloud-speed. Turn virtually any raw, unrefined data into actionable information and beautiful data visualization faster than ever before, all on a single platform.

Rapid ingest of new data sources with AI:

  • Got a hot new leads file?
  • Just found out a new way to tell which vehicles will have the lowest claims this year?

Instantly add and integrate new sources to your dataset with Inzata’s powerful AI data integration. Integrating new data sources and synthesizing new columns and values on the fly can enhance an organization’s decision-making but doing so also increases the company’s data storage requirements.

The Power of Real-Time Performance: Your insights and queries are more most valuable if they get to you in time. In a competitive market where leads convert or abandon in seconds, having the speediest insights makes a huge difference. Inzata’s real-time capabilities and support for connecting to streaming data sources for analysis means you always have the most up-to-the minute information.

Make data even more valuable with Data Enrichment (One-Click-EnrichmentsTM):  Enrich and improve the value and accuracy of your data with dozens of free data enrichment datasets – all within a single, secure platform.

Inzata offers more than 40 enrichments include: Geo-spatial, Advanced Consumer and Place Demographics, Political Data overlays, Weather data, and Healthcare Diagnosis Codes. Plus more than 200 API connectors to bring in data from web and cloud sources.

Security and Compliance: Cloud data warehouses can provide greater security and compliance than on-premises systems. Inzata is available with HIPAA compliance and PCI DSS certification and maintains security compliance and attestations including SOC 2, Type 1 and 2.

Real-time Data Sharing:Secure and governed, account-to-account data sharing in real time reduces unnecessary data exports while delivering data for analysis and risk scoring.

Harness the Power of Insurance Data Analytics

As insurance evolves into an even more data-driven industry, business processes that used to take hours and days are going to be compressed down to seconds. Companies who properly anticipate these changes will reap the benefits in the form of more customers, higher profits and greater market share.

Inzata is an ideal platform for insurers to take the step toward real-time, AI powere analytics that will shape the industry for decades to come.

Categories
Data Analytics

Top 5 Data Analysis Trends in 2019

As businesses transform into data-driven enterprises, data technologies and strategies need to start delivering value. Here are 5 data analytics trends to watch out for in 2019…

What makes data quality management the most important trend in 2019?

The internet is on the rise and so is the availability of big data collection techniques. These big data collection techniques are facilitated by different artificial intelligence software. Over the past year it has not just been about collection of data, rather more about the quality of the data and the context in which the data is interpreted and used, which serves as most crucial aspect of business analytics. Moreover, a survey conducted by Business Application Research Centre also states that data quality management is the most important trend of 2019.

How will data lakes survive in 2019?

Not long ago, storing and obtaining actionable insights from big data was difficult. Now, with data lakes, you can store everything in a single data repository and enterprise-wide data management for everything from business analytics to data monetization. However, while storing big data in one place has been beneficial, revealing insights from that data has been difficult. In order for the data lakes to survive in 2019, it will have to prove its ‘business value’ as Ken Hoang says. This could be done by changing the ways of presenting data thereby enabling decision makers to have a deeper insight.

R Language in Data Analytics

There are a variety of ways to analyze data using statistical tools and other similar methods, but the most effective is using tools that integrate with R language. R is one of the best and the easiest way to conduct advanced data analysis since it can be audited and rerun easily, unlike spreadsheet software. It also provides a wide range of statistical techniques, making it a trendsetter of 2019.

What is cloud storage and analysis?

Cloud computing is an efficient way of doing data analytics, in fact it is a mantra one should follow, otherwise your big data faces delays if it moves across a local network and even larger delays if goes through the internet. As the amount of data increases in your computer the capacity of your data center decreases. So, in order to cater to the big data, cloud storage should be added in your computer. Along with your big data, your analysis should be in cloud too. More and more companies are switching to cloud storage as the amount of data they collect continues to grow each and every day.

Why are mobile dashboards heating up?

In this fast-paced world with everyone on the go, data management tools need to present more mobile friendly dashboards that are useful and timely for business analytics. Since many business leaders hardly have the time to sit back at their desks, this business intelligence tool is very important. Most self service business intelligence tools have this capability, but not all do; hence this should be utmost priority for every business analytics platform. 

Categories
Data Monetization

Why Should I Monetize My Company’s Data?

Taking advantage of big data systems is a challenge that many companies are just beginning to confront. Within these efforts are serious questions about how data monetization can be done to increase revenue. It can be helpful, however, to think about what exactly data monetization is and how data analytics can be employed to turn a profit.

What is Data Monetization?

Most companies have the capacity to collect information about their customers, marketing efforts, operations, etc. From the data that’s collected during registration of products to information gleaned from shifts in inventories, a lot of organizations are churning through significant amounts of data, regardless of whether they’re truly taking advantage of it. When those efforts become focused on turning a profit through re-selling their non-private data, that’s when it becomes a monetization effort.

The How

A business has to develop a commitment to collecting and using big data. Information can be culled from a variety of inputs, but the critical thing is that the data then be stored in databases, processed through a data analytics platform, and organized in a style that is able to be presented and sold. This means developing a process that can handle the amount of data and an internal culture that seeks the connection between big data insights and revenue, i.e. the goal of any data monetization process.

Should I Sell Data?

The simplest business case for data monetization also happens to be one of the most difficult for companies to use: selling data. While it’s straightforward from a conceptual standpoint, it ends up being the most challenging because sellable data has to be something that can’t be found elsewhere and you need to have an insane amount of it. For a company like Facebook, which has built its entire business model on selling data, that’s fine. For a firm that’s established in a different sector, such as retail or healthcare, it may simply be prohibitively difficult to pull off. There are also frequently ethical and legal concerns that accompany such a business model. 

Stopping Revenue Losses

At most operations, there’s a sense that money is being lost, but putting business processes in place to prevent those losses isn’t always simple. One advantage of leveraging big data at a company is that it allows you to scan through a large amount of information to try to find patterns that humans would either never recognize or take years to identify.

In the healthcare world, for example, segmentation is being increasingly employed in the billing and collections processes. A hospital’s collections department might determine, based on what it has learned from data analytics, that a segment of the population is highly unlikely to respond to a phone call about an outstanding bill. They can then divert resources toward seeking collections from patients who are more likely to answer their phones and agree to pay their bills. Similar approaches can be used by companies to deal with fraud, piracy, counterfeiting and theft-of-services issues.

This kind of information is what other companies are willing to buy. They see the value of investing in information that will prevent a decrease in revenue while also avoiding discovering such insights themselves. Essentially, they will spend money to avoid losing even more money, and time.

Selling Answers

A quality big data operation can become an asset in its own right. If you have data scientists in place and people already generating insights, you can sell those insights as products. In the financial sector, we see major players like Gartner regularly selling the answers they’ve gleaned from their existing efforts. Being able to get insights out of your data is more valuable than being able to collect and process it, and others who’ve struggled to complete that final step will often pay well to not have to bother with it themselves.

Changing Customer Relationships

Just as customers can be segmented to reduce losses, they also can be segmented to drive growth in sales. Many retailers have found, for example, that potential repeat customers are often just waiting to be given the right offer. If you have an email marketing list in place, you can test different offers and analyze who responds to which pitches. In fact, many websites have turned this into their main business model.

This is another example of data that is worth monetizing. If a retailer has customer purchase behavior data, there is no doubt that it is extremely valuable to another non-competing retailer.

In Conclusion

The amount of time and resources that goes into collecting any type of data is something of value. It is human nature to prefer to pay for something to be done, rather than doing it yourself, at least when it comes to something so tedious. Companies that have spent years and years gathering big data, whether it be from customers, products, services, operations, etc., could possibly have a monopoly on extremely useful information that other companies are willing to purchase.

With the right data analytics tools, big data can be monetized in minutes. Are you investing in your big data?

Polk County Schools Case Study in Data Analytics

We’ll send it to your inbox immediately!

Polk County Case Study for Data Analytics Inzata Platform in School Districts

Get Your Guide

We’ll send it to your inbox immediately!

Guide to Cleaning Data with Excel & Google Sheets Book Cover by Inzata COO Christopher Rafter