Only about one-third of enterprise data is utilized after its creation, leaving a significant 68% of data unleveraged in a business (Seagate Technology, 2020). This indicates that most companies fail to leverage the majority of their data for gaining valuable insights. This is where Inzata is stepping in with its outstanding ability to build a Data Warehouse within 3 to 4 days (Inzata, 2023). Using the Inzata platform’s tools for data exploration and analysis effectively is dependent on the user’s ability to properly manage and utilize their data through steps such as ingesting, transformation, integration, and visualizing, therefore it is essential to look into each step of the data exploration process in order to maximize the platform’s protentional.
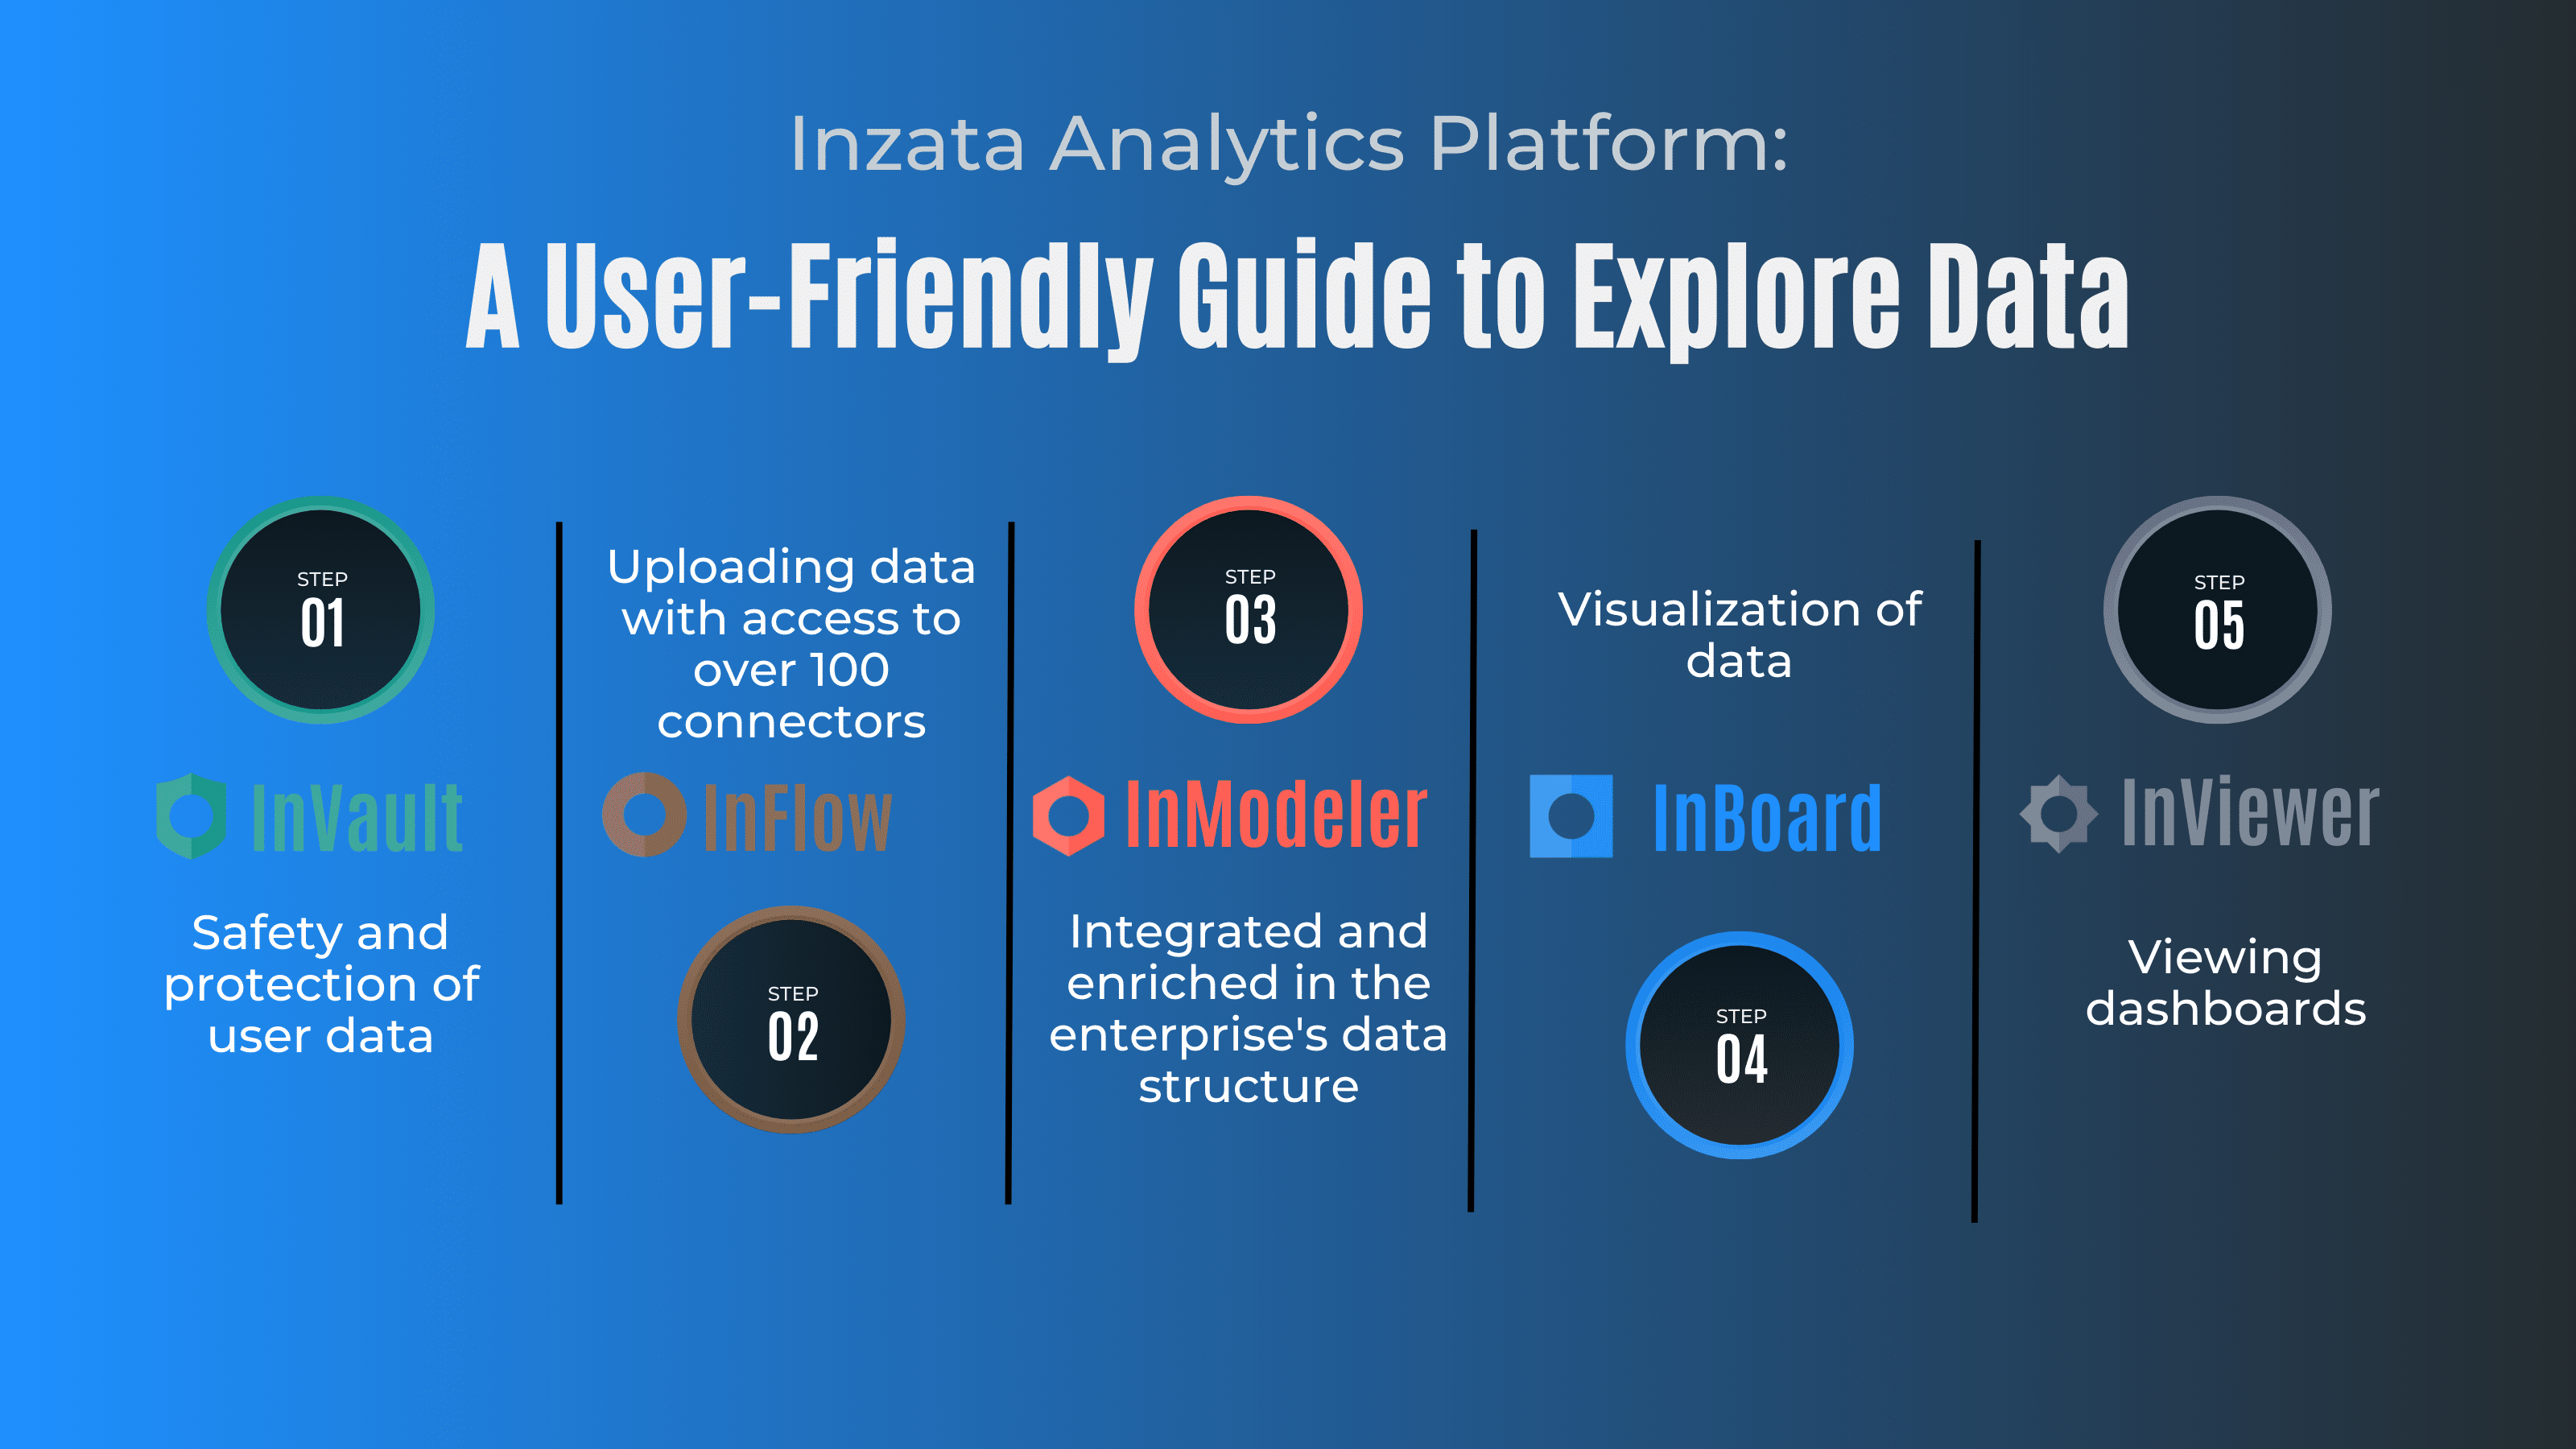
The Inzata platform is a platform with a user-friendly interface, powered by AI with the ability to analyze large portions of data, to join, integrate, explore, and visualize them in one place while emphasizing users’ self-administration approach. It consists of five main programs that enable a step-by-step process for exploring data: InVault, InFlow, InModeler, InBoard, and InViewer. Let’s demonstrate an example where a customer is a social media manager at a company that uses Twitter, Instagram, and TikTok to promote their company. They want to analyze the engagement metrics for each platform to see which one has the best outcome and which one needs improvement. Here is an example of how to use the Inzata platform:
The first and one of the most important steps is to ensure the safety and protection of user data, which is achieved by using the InVault module. Here, the user can select their role and add additional users to work on the project. As a creator of the project, he can also assign roles to other users and grant them access to them in the project. InVault is also utilized to manage access to data and applications by determining which users can view the data and which modules of the platform they can use. This ensures that user data is only accessible by authorized personnel and that the appropriate modules of the platform are utilized for data analysis and visualization.
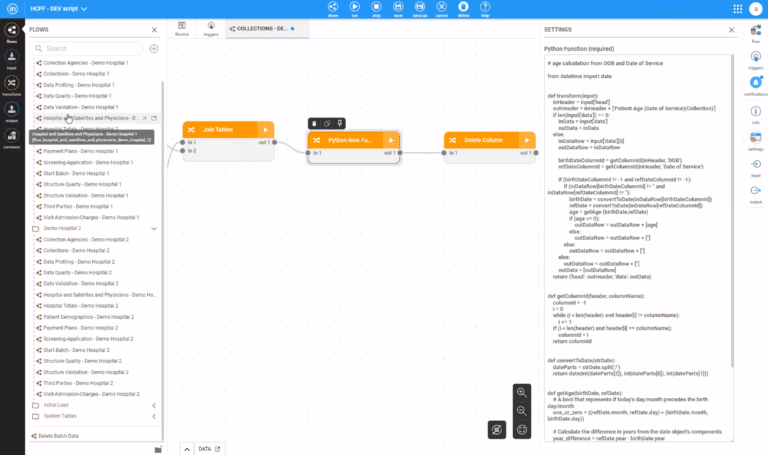
To upload data to the Inzata platform, the second step is to use the InFlow program, which provides access to over 100 connectors. InFlow uses automated tools to extract and process data from various sources, connecting with the source system via pre-built connectors for platforms such as Twitter, Instagram, and TikTok. This involves connecting to each platform’s API and extracting data like tweets, posts, and engagement metrics. API stands for application program interface, which is a set of computer methods that different computer programs use to communicate with each other. Similarly to how people use language to communicate, computer programs use APIs to share information and work together. Once the data is extracted, the InFlow program transforms it and integrates it into a format that reflects analytical requirements. By using InFlow, users can quickly and easily upload data from various sources into the Inzata platform for further analysis and visualization.
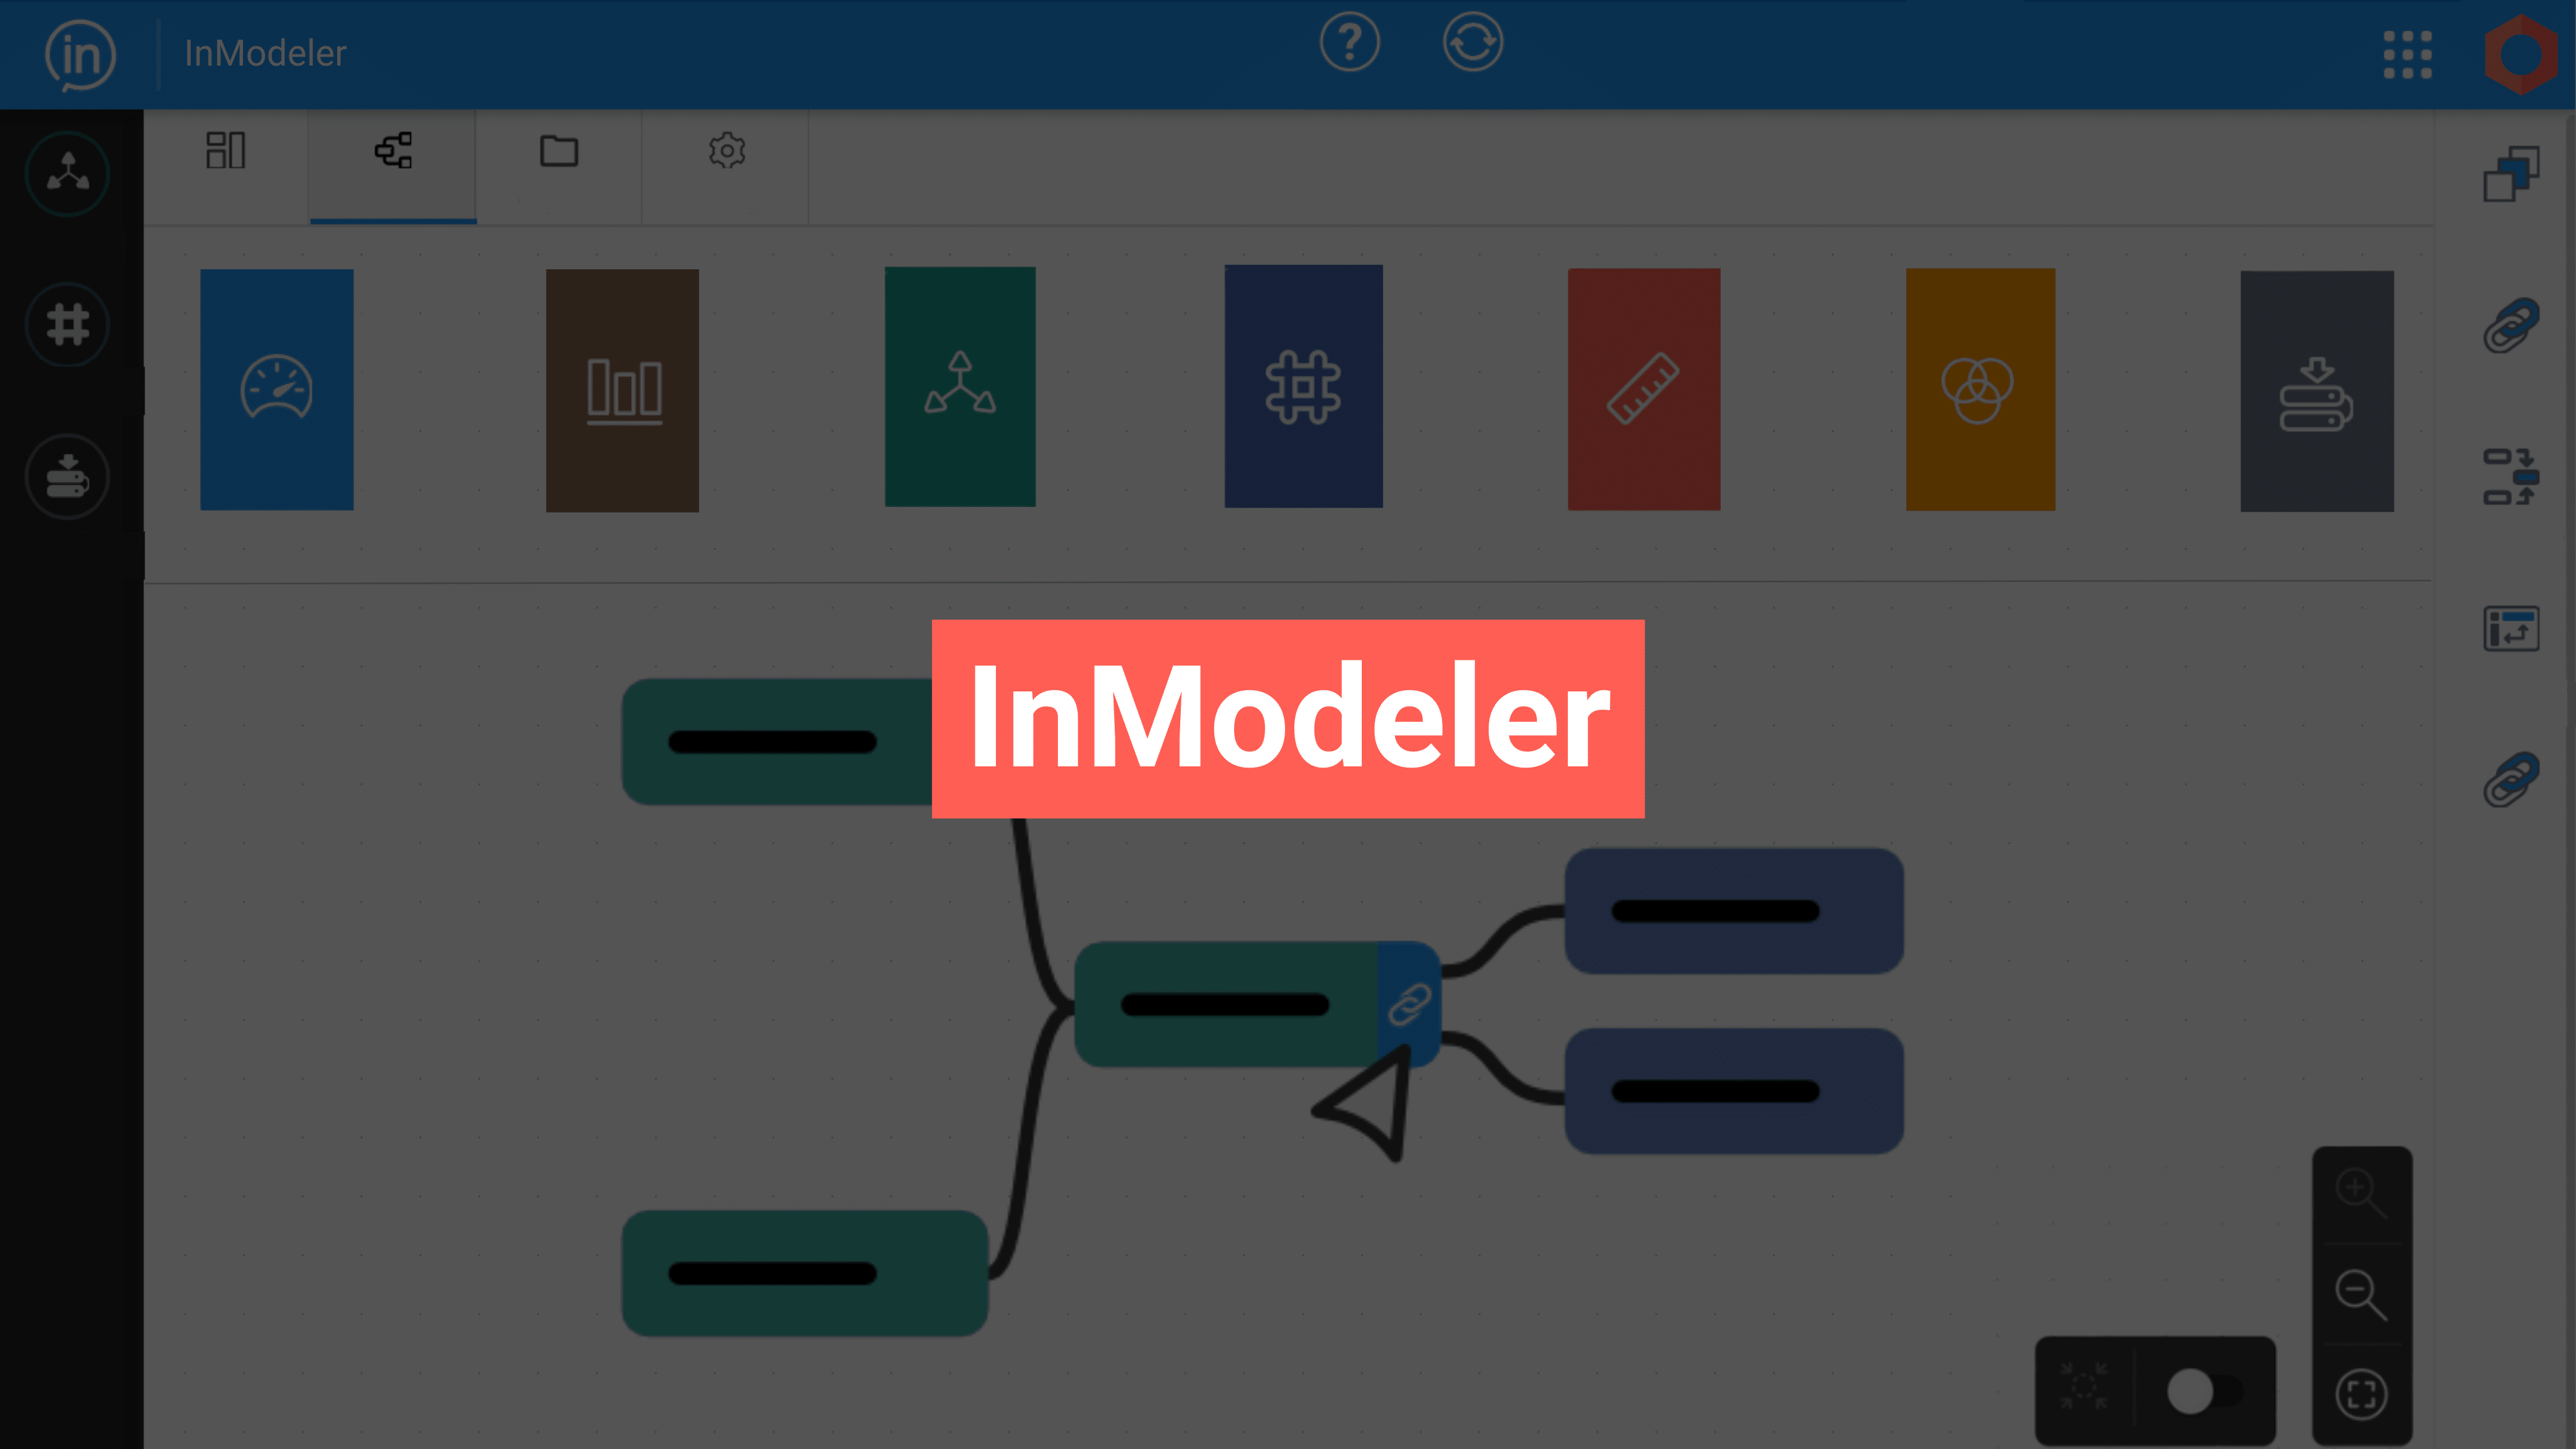
Afterwards, it can be enriched and integrated in the enterprise analytical data structure by using InModeler module. The data is saved in Inzata’s internal storage system. This system utilizes data optimization features to enhance the speed at which the stored data can be accessed while generating reports and dashboards. In addition, the Inzata platform’s InModeler module enables users to integrate data originally coming from various sources, including Twitter, Instagram, and TikTok, which are originally separated files. The IM software automatically categorizes each data column as either an attribute (such as username or time) or a fact (like engagement metrics) upon import. It also adds details to the data such as geographical location and time to aid analysis (data enrichment). After organizing and enriching the data, InModeler combines the various data files based on common information to create a more comprehensive and usable data structure for analytical and reporting purposes. Inzata’s patented automated data aggregation engine then produces and processes reports with essential data information, such as user engagement numbers for each social media site and trends over time. This enables users to quickly and easily analyze data from multiple sources in order to make better business decisions. In addition, InModeler utilizes Artificial Intelligence and Machine Learning algorithm to streamline the data guessing and analytical process. IM system recommends the best joins for the user’s data, making it simpler to combine data from multiple sources into a unified view. InModeler assists users in developing and launching a data analytics capacity for any company. This allows users to leverage their data more effectively and gain valuable insights.
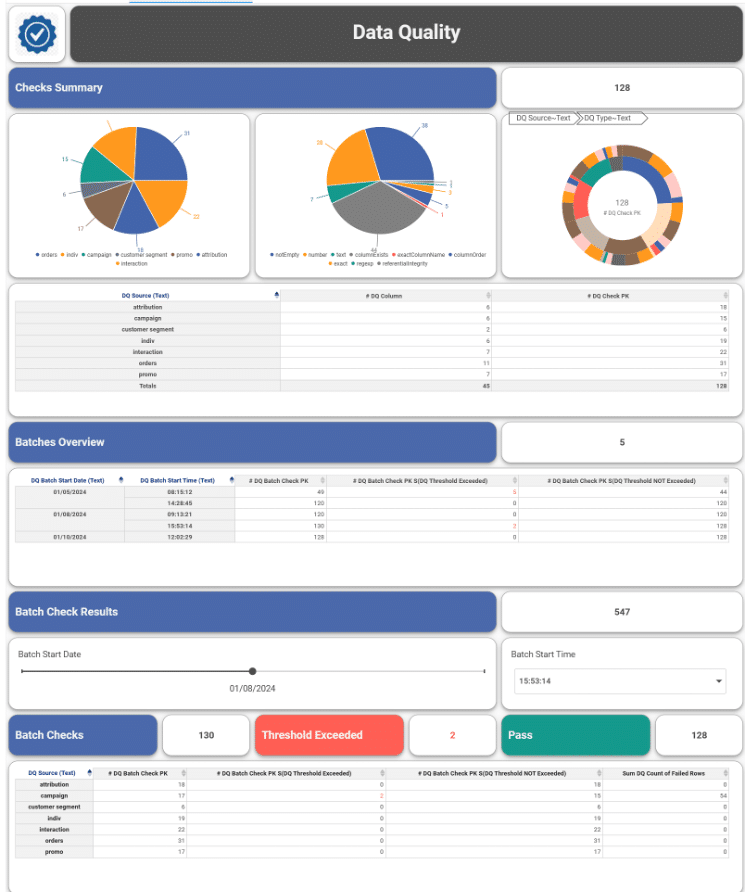
The Inzata platform’s InBoard program offers a user-friendly interface for visualizing data. Users can create custom dashboards, choosing from over 25 types of graphs and the ability to insert pictures and logos. Recently, Inzata added new dashboard templates in many different colors, each with a light and dark shade. These templates, including Ambient, Pastel, Neon, Modern Retro, and Brutalism, allow users quickly to organize their data in a way that suits them best, or they can create and save their own dashboard templates. InBoard’s ‘Layered Reports’ feature allows users to easily access multiple reports within one dashboard, providing more freedom and information. This feature enables customers to obtain information quickly and improves dashboard interactivity and organization. Even those without coding expertise can use InBoard to visualize their data efficiently.
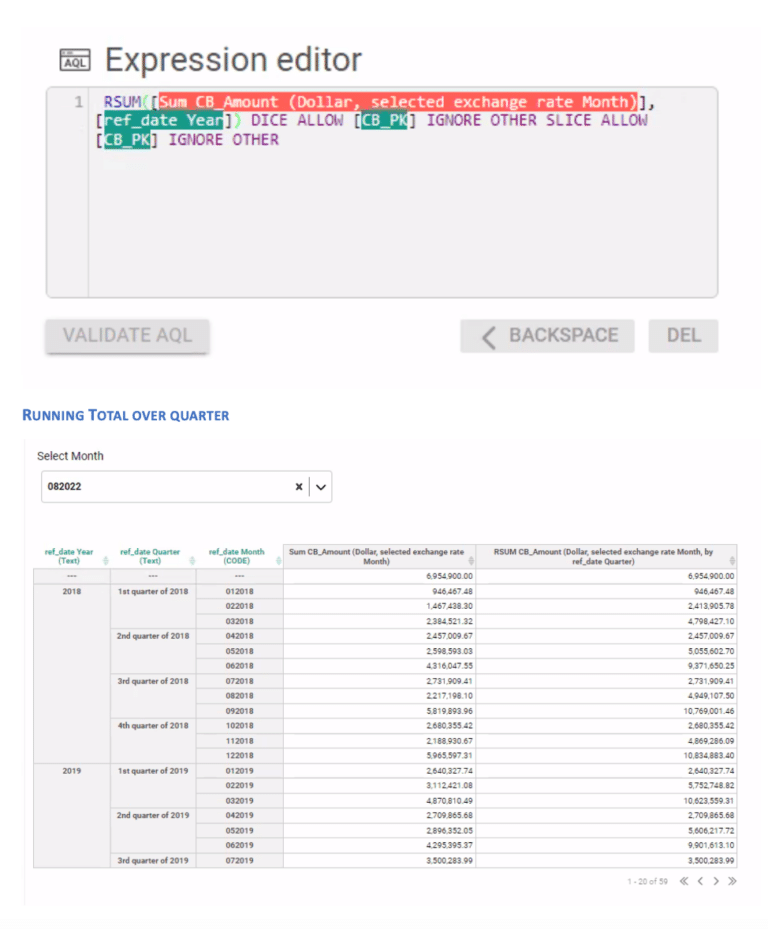
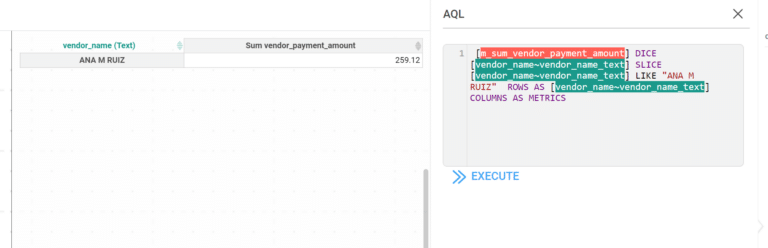
The Inzata platform’s final program is InViewer, which allows users to view dashboards in their chosen templates and the full dashboard design. The drill across and drill down analytical capabilities allow data slicing and dicing in the way a user wants to see data without any coding/creating new reports. In our example, the user can now track social media metrics and create a dashboard that displays Instagram, Twitter, and TikTok analytics. Once the dashboard is complete, it can be exported as a PDF document or uploaded directly to a website by using InViewer’s built-in capabilities.
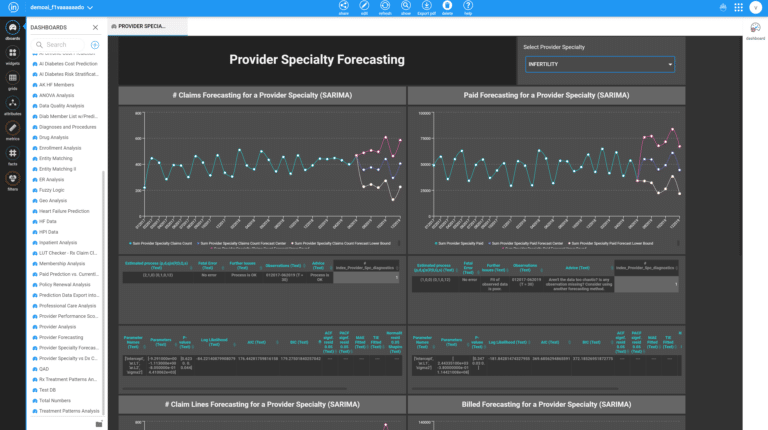
In conclusion, using the Inzata platform can be a game-changer in the way quickly and effectively a full BI system can be built for businesses seeking to make better use of their data. By following the step-by-step process of securing, combining, integrating, and visualizing data, users can quickly and easily extract valuable insights that can lead to more informed decision-making. The platform’s user-friendly interface and AI-powered tools make it accessible to users of all skill levels, while its range of customizable dashboards and templates allow for a personalized data exploration experience not only on historical data, but also on predicted future values. With Inzata, businesses can optimize their data usage and unlock their full potential to drive growth and success.