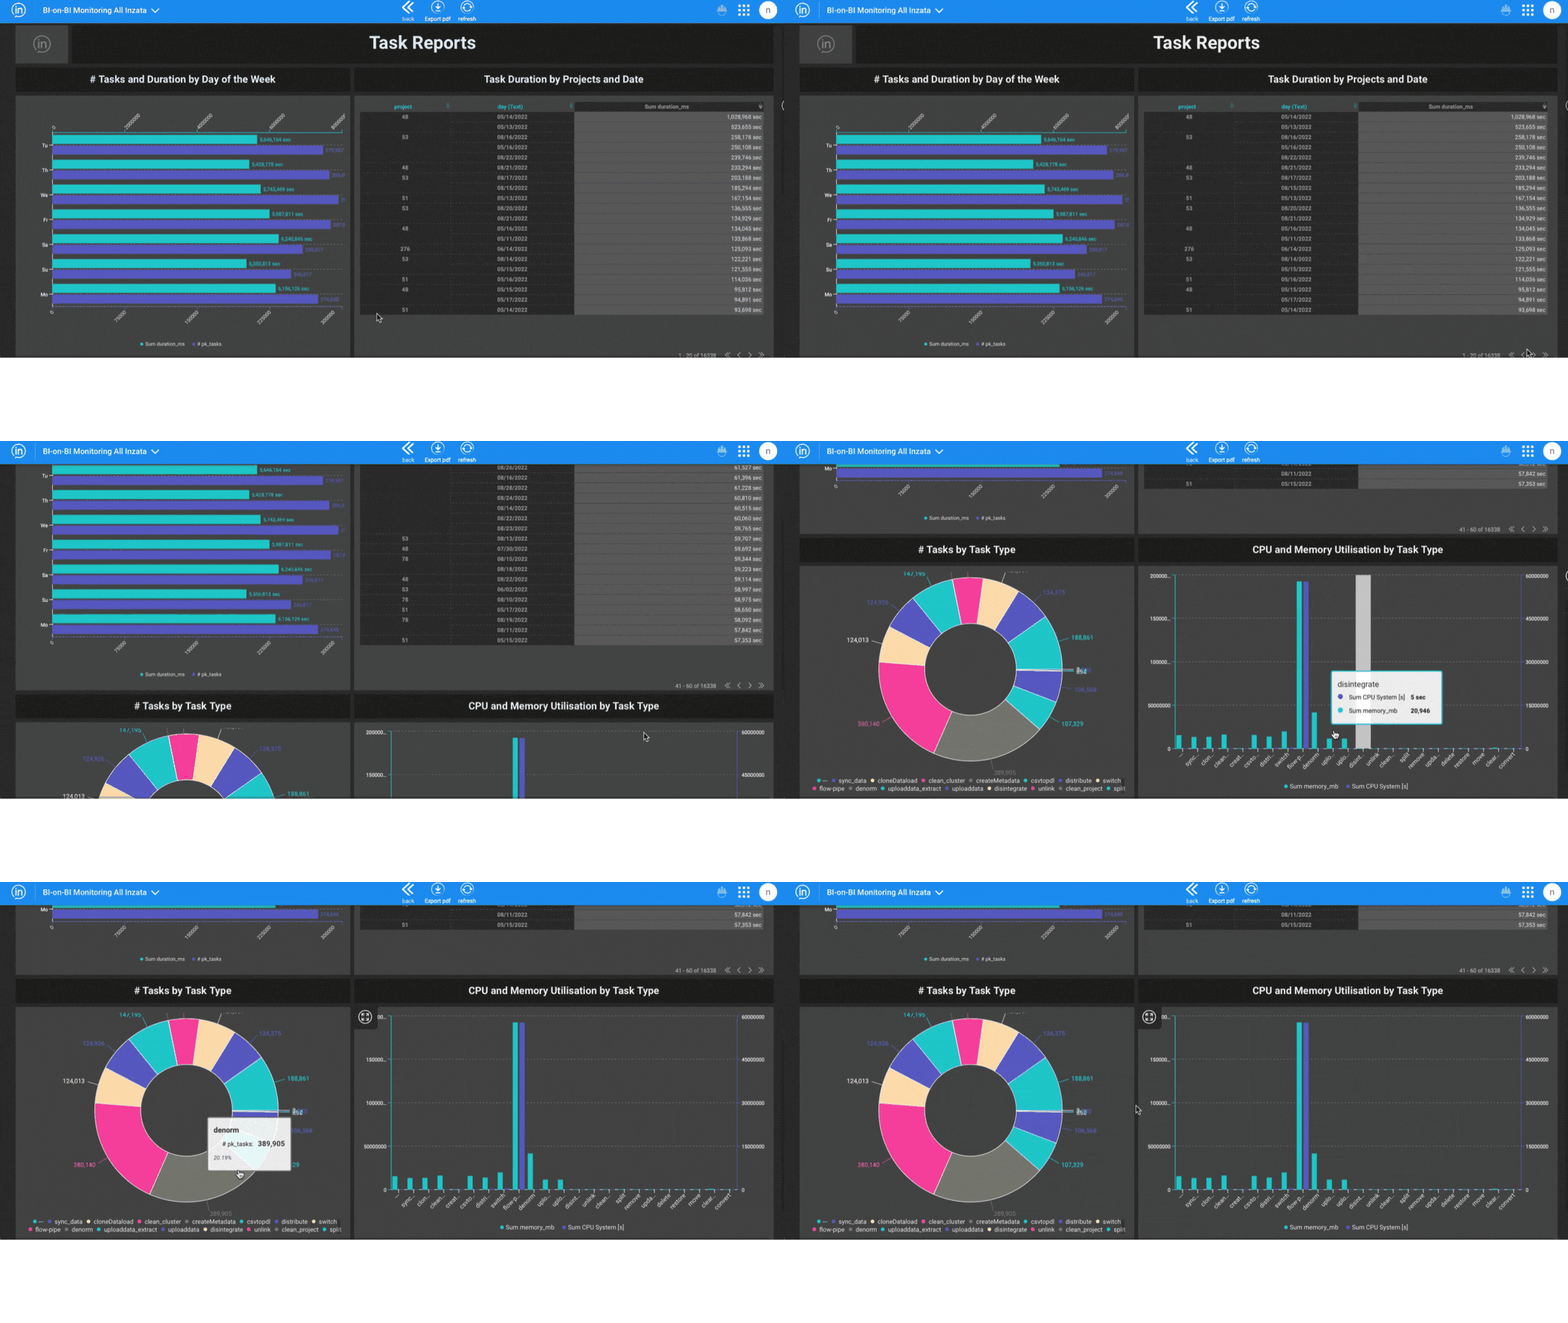
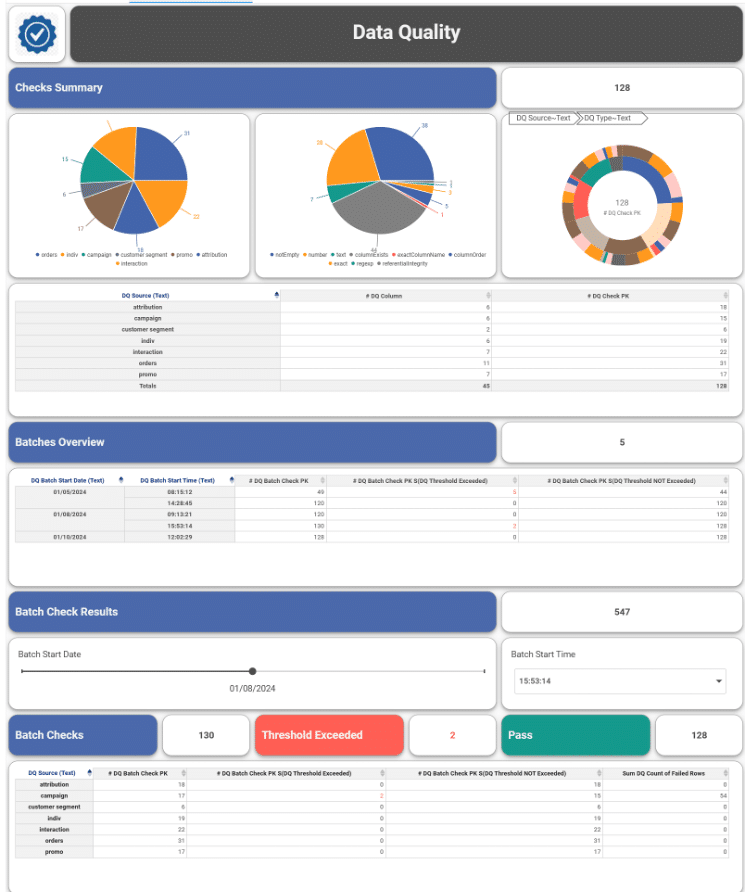
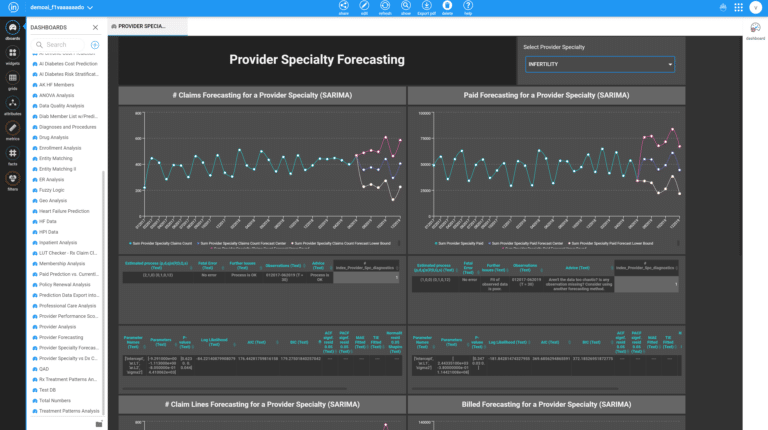
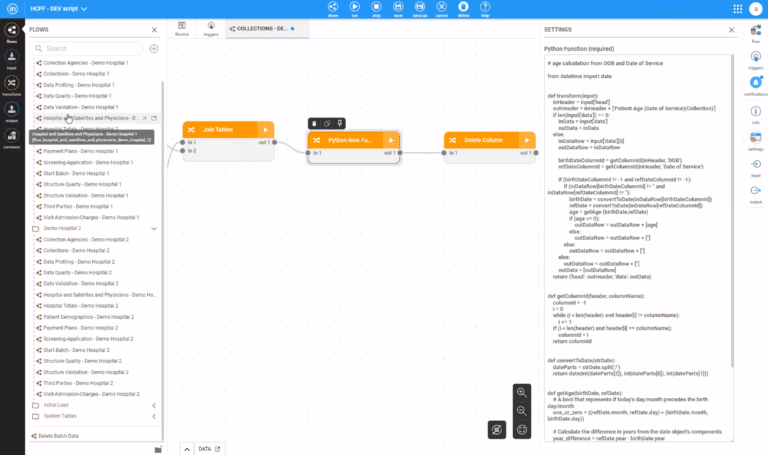
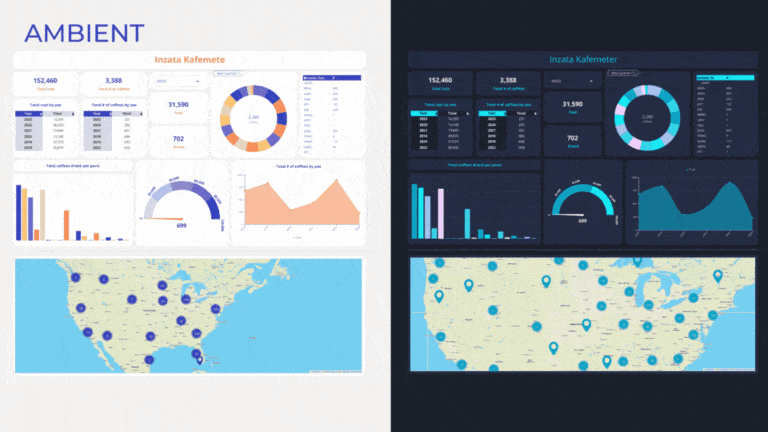
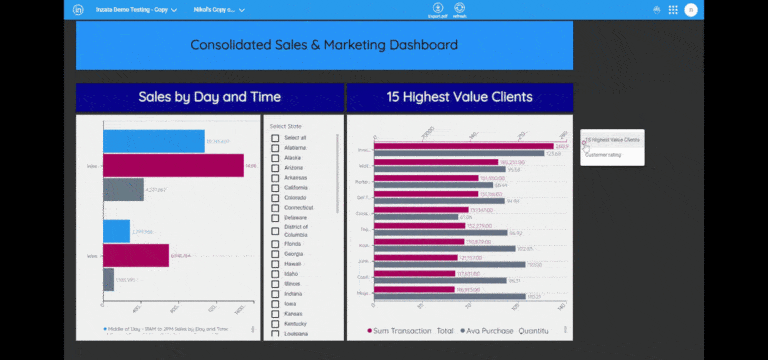
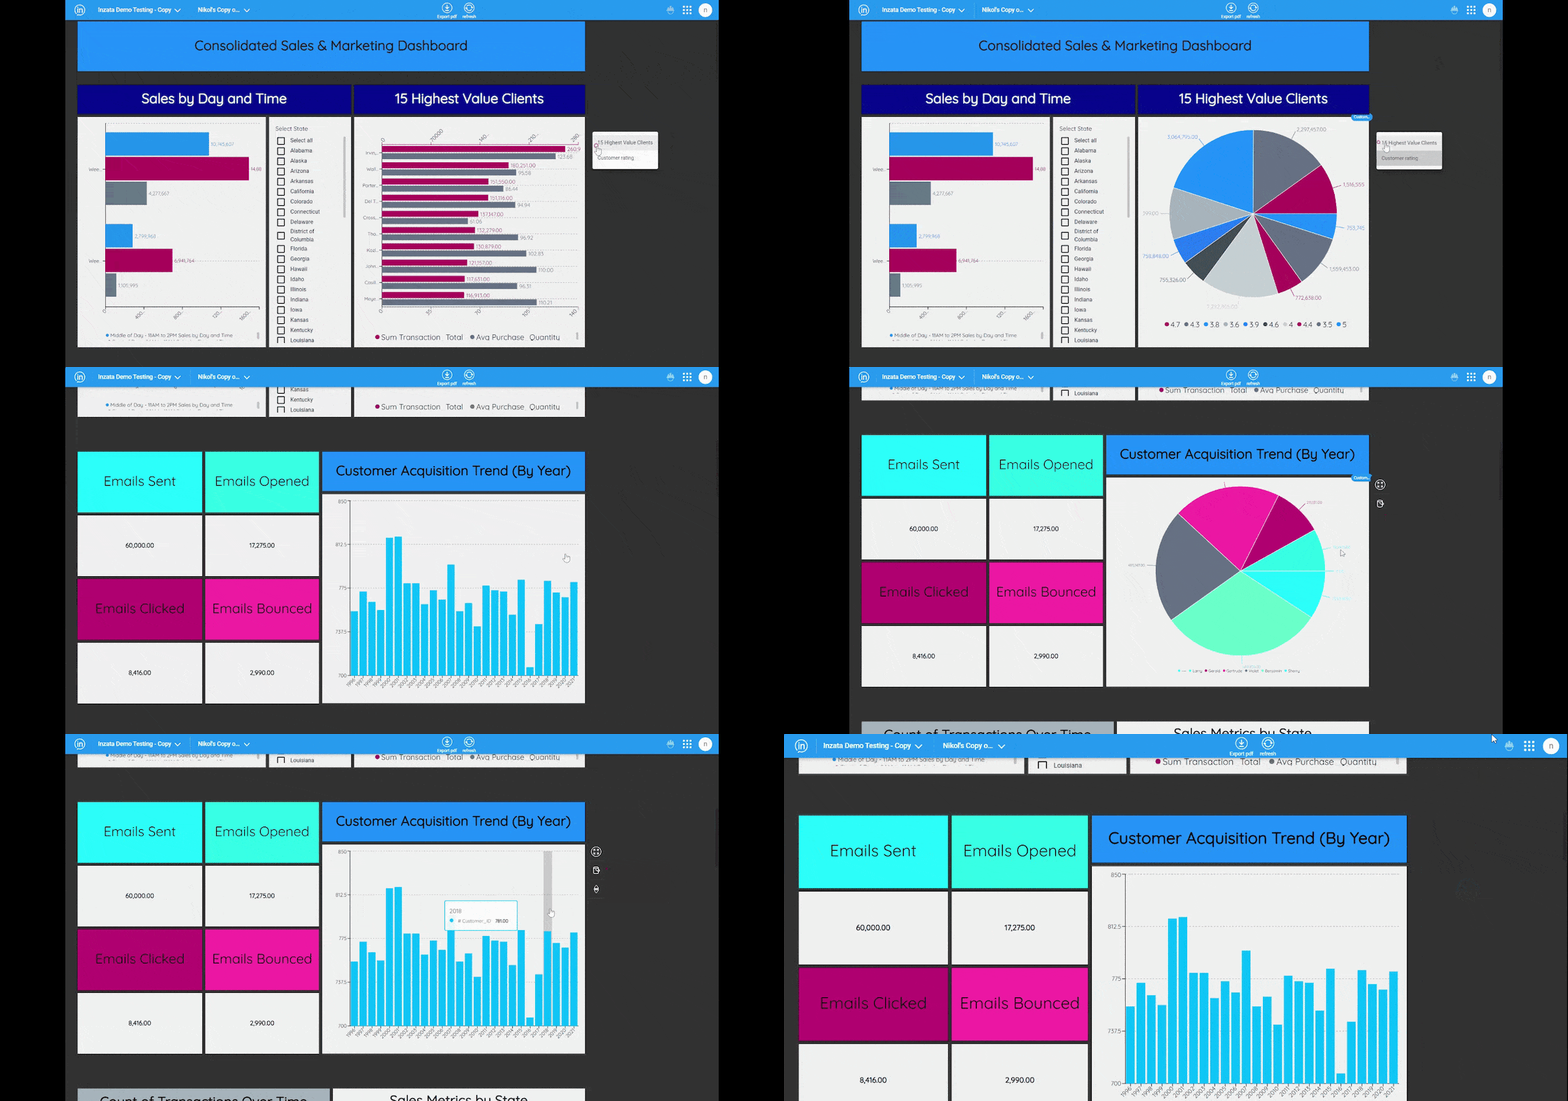
The activity of users and data loading jobs can be done on the fly and monitored by the Inzata Live Monitoring System. Dashboards that contain many useful reports and analytics for the Inzata Platform monitoring:
- Daily System Utilization (disk size overall, by project, # instances, etc.)
- Performance Status (system request counts, duration, etc.)
- User Access Stats (access rights, user roles, module authorization, etc.)
- System Utilization (By time and projects, day of the week, Task type, etc.)
- Projects/Client and Users statistics (User counts by projects, current user activity in terms of the active report, Dashboard durations, User errors popped up, etc.)
These features allow administrators to have a comprehensive view of the platform’s usage and performance, enabling them to identify and address any issues that may arise, ensuring smooth operations and improving user experience.
